
Page 102 - Read Online
P. 102
Page 8 of 26 Li et al. Cancer Drug Resist. 2025;8:31
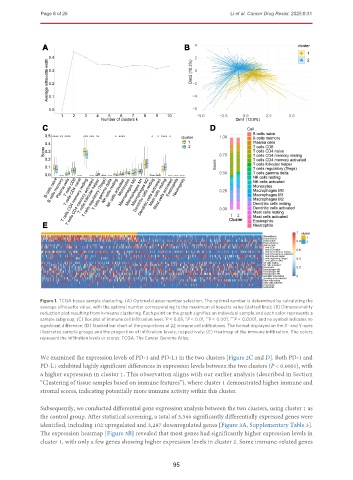
Figure 1. TCGA tissue sample clustering. (A) Optimal cluster number selection. The optimal number is determined by calculating the
average silhouette value, with the optimal number corresponding to the maximum silhouette value (dotted line); (B) Dimensionality
reduction plot resulting from k-means clustering. Each point on the graph signifies an individual sample and each color represents a
sample subgroup; (C) Box plot of immune cell infiltration level. P < 0.05, P < 0.01, P < 0.001, P < 0.0001, and no symbol indicates no
*
***
**
****
significant difference; (D) Stacked bar chart of the proportions of 22 immune cell infiltrations. The format displayed on the X- and Y-axes
illustrates sample groups and the proportion of infiltration levels, respectively; (E) Heatmap of the immune infiltration. The colors
represent the infiltration levels or scores. TCGA: The Cancer Genome Atlas.
We examined the expression levels of PD-1 and PD-L1 in the two clusters [Figure 2C and D]. Both PD-1 and
PD-L1 exhibited highly significant differences in expression levels between the two clusters (P < 0.0001), with
a higher expression in cluster 1. This observation aligns with our earlier analysis (described in Section
“Clustering of tissue samples based on immune features”), where cluster 1 demonstrated higher immune and
stromal scores, indicating potentially more immune activity within this cluster.
Subsequently, we conducted differential gene expression analysis between the two clusters, using cluster 1 as
the control group. After statistical screening, a total of 3,389 significantly differentially expressed genes were
identified, including 102 upregulated and 3,287 downregulated genes [Figure 3A, Supplementary Table 3].
The expression heatmap [Figure 3B] revealed that most genes had significantly higher expression levels in
cluster 1, with only a few genes showing higher expression levels in cluster 2. Some immune-related genes
95