
Page 174 - Read Online
P. 174
Page 6 of 15 Rong et al. Vessel Plus 2019;3:18 I http://dx.doi.org/10.20517/2574-1209.2019.007
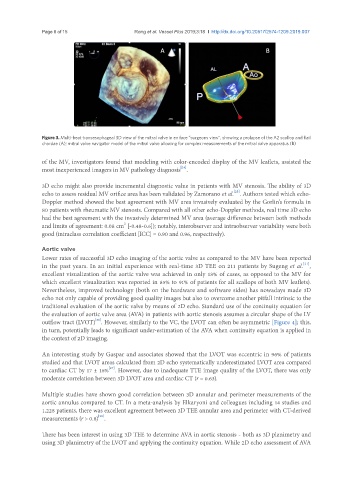
Figure 3. Multi-beat transesophageal 3D view of the mitral valve in en face “surgeons view”, showing a prolapse of the A2 scallop and flail
chordae (A); mitral valve navigator model of the mitral valve allowing for complex measurements of the mitral valve apparatus (B)
of the MV, investigators found that modeling with color-encoded display of the MV leaflets, assisted the
[24]
most inexperienced imagers in MV pathology diagnosis .
3D echo might also provide incremental diagnostic value in patients with MV stenosis. The ability of 3D
[25]
echo to assess residual MV orifice area has been validated by Zamorano et al. . Authors tested which echo-
Doppler method showed the best agreement with MV area invasively evaluated by the Gorlin’s formula in
80 patients with rheumatic MV stenosis. Compared with all other echo-Doppler methods, real time 3D echo
had the best agreement with the invasively determined MV area (average difference between both methods
2
and limits of agreement: 0.08 cm [-0.48-0.6]); notably, interobserver and intraobserver variability were both
good (intraclass correlation coefficient [ICC] = 0.90 and 0.96, respectively).
Aortic valve
Lower rates of successful 3D echo imaging of the aortic valve as compared to the MV have been reported
[21]
in the past years. In an initial experience with real-time 3D TEE on 211 patients by Sugeng et al. ,
excellent visualization of the aortic valve was achieved in only 18% of cases, as opposed to the MV for
which excellent visualization was reported in 85% to 91% of patients for all scallops of both MV leaflets).
Nevertheless, improved technology (both on the hardware and software sides) has nowadays made 3D
echo not only capable of providing good quality images but also to overcome another pitfall intrinsic to the
traditional evaluation of the aortic valve by means of 2D echo. Standard use of the continuity equation for
the evaluation of aortic valve area (AVA) in patients with aortic stenosis assumes a circular shape of the LV
[26]
outflow tract (LVOT) . However, similarly to the VC, the LVOT can often be asymmetric [Figure 4]; this,
in turn, potentially leads to significant under-estimation of the AVA when continuity equation is applied in
the context of 2D imaging.
An interesting study by Gaspar and associates showed that the LVOT was eccentric in 96% of patients
studied and that LVOT areas calculated from 2D echo systematically underestimated LVOT area compared
[27]
to cardiac CT by 17 ± 16% . However, due to inadequate TTE image quality of the LVOT, there was only
moderate correlation between 3D LVOT area and cardiac CT (r = 0.63).
Multiple studies have shown good correlation between 3D annular and perimeter measurements of the
aortic annulus compared to CT. In a meta-analysis by Elkaryoni and colleagues including 14 studies and
1,228 patients, there was excellent agreement between 3D TEE annular area and perimeter with CT-derived
[28]
measurements (r > 0.8) .
There has been interest in using 3D TEE to determine AVA in aortic stenosis - both as 3D planimetry and
using 3D planimetry of the LVOT and applying the continuity equation. While 2D echo assessment of AVA