
Page 108 - Read Online
P. 108
Page 18 of 41 Rao. Vessel Plus 2022;6:25 https://dx.doi.org/10.20517/2574-1209.2021.92
Figure 29. Echo-Doppler images of the atrial septum in apical four-chamber projections illustrating left-to-right shunt across an atrial
septal defect (ASD) before (A) and 3 months following (B) deployment of a buttoned device. No residual shunt is observed in (B). A
black arrow shows the occluder (O) on the left atrial (LA) and a white arrow shows the counter-occluder (CO) end in the right atrial
(RA) side of the atrial septum. The left ventricle (LV) and right ventricle (RV) are labeled. Reproduced from Ref. [27] .
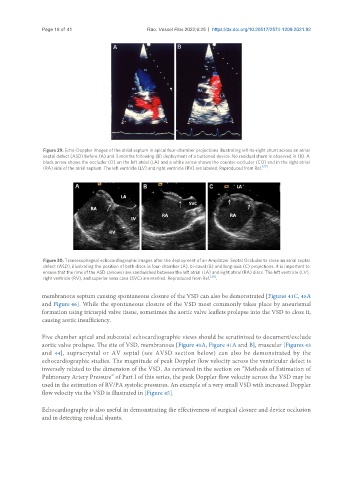
Figure 30. Transesophageal echocardiographic images after the deployment of an Amplatzer Septal Occluder to close an atrial septal
defect (ASD), illustrating the position of both discs in four-chamber (A), bi-caval (B) and long-axis (C) projections. It is important to
ensure that the rims of the ASD (arrows) are sandwiched between the left atrial (LA) and right atrial (RA) discs. The left ventricle (LV),
right ventricle (RV), and superior vena cava (SVC) are marked. Reproduced from Ref. [30] .
membranous septum causing spontaneous closure of the VSD can also be demonstrated [Figures 41C, 45A
and Figure 46]. While the spontaneous closure of the VSD most commonly takes place by aneurismal
formation using tricuspid valve tissue, sometimes the aortic valve leaflets prolapse into the VSD to close it,
causing aortic insufficiency.
Five chamber apical and subcostal echocardiographic views should be scrutinized to document/exclude
aortic valve prolapse. The site of VSD, membranous [Figure 40A, Figure 41A and B], muscular [Figures 43
and 44], supracrystal or AV septal (see AVSD section below) can also be demonstrated by the
echocardiographic studies. The magnitude of peak Doppler flow velocity across the ventricular defect is
inversely related to the dimension of the VSD. As reviewed in the section on “Methods of Estimation of
Pulmonary Artery Pressure” of Part I of this series, the peak Doppler flow velocity across the VSD may be
used in the estimation of RV/PA systolic pressures. An example of a very small VSD with increased Doppler
flow velocity via the VSD is illustrated in [Figure 45].
Echocardiography is also useful in demonstrating the effectiveness of surgical closure and device occlusion
and in detecting residual shunts.