
Page 113 - Read Online
P. 113
Rao. Vessel Plus 2022;6:25 https://dx.doi.org/10.20517/2574-1209.2021.92 Page 23 of 41
Figure 39. Two-dimensional (A) and color Doppler (B, C and D) images from subcostal short-axis views of the atrial septum
demonstrating a patent foramen ovale (PFO) (arrow in A) with a left-to-right shunt (thin arrows in B, C and D). Note the overlapping of
the septum primum over the septum secundum in (A), suggesting that this atrial defect is a PFO. Descending aorta (DAo), left atrium
(LA), right atrium (RA), and superior vena cava (SVC) are marked. Reproduced from Ref. [16] .
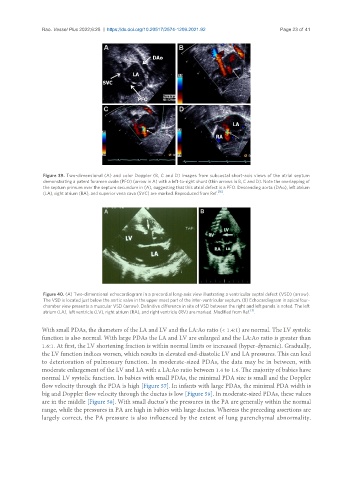
Figure 40. (A) Two-dimensional echocardiogram in a precordial long-axis view illustrating a ventricular septal defect (VSD) (arrow).
The VSD is located just below the aortic valve in the upper most part of the inter-ventricular septum. (B) Echocardiogram in apical four-
chamber view presents a muscular VSD (arrow). Definitive difference in site of VSD between the right and left panels is noted. The left
[3]
atrium (LA), left ventricle (LV), right atrium (RA), and right ventricle (RV) are marked. Modified from Ref. .
With small PDAs, the diameters of the LA and LV and the LA:Ao ratio (< 1.4:1) are normal. The LV systolic
function is also normal. With large PDAs the LA and LV are enlarged and the LA:Ao ratio is greater than
1.6:1. At first, the LV shortening fraction is within normal limits or increased (hyper-dynamic). Gradually,
the LV function indices worsen, which results in elevated end-diastolic LV and LA pressures. This can lead
to deterioration of pulmonary function. In moderate-sized PDAs, the data may be in between, with
moderate enlargement of the LV and LA with a LA:Ao ratio between 1.4 to 1.6. The majority of babies have
normal LV systolic function. In babies with small PDAs, the minimal PDA size is small and the Doppler
flow velocity through the PDA is high [Figure 57]. In infants with large PDAs, the minimal PDA width is
big and Doppler flow velocity through the ductus is low [Figure 59]. In moderate-sized PDAs, these values
are in the middle [Figure 58]. With small ductus’s the pressures in the PA are generally within the normal
range, while the pressures in PA are high in babies with large ductus. Whereas the preceding assertions are
largely correct, the PA pressure is also influenced by the extent of lung parenchymal abnormality.