
Page 151 - Read Online
P. 151
Ding et al. Soft Sci. 2026, 6, 2 Page 9 of 15
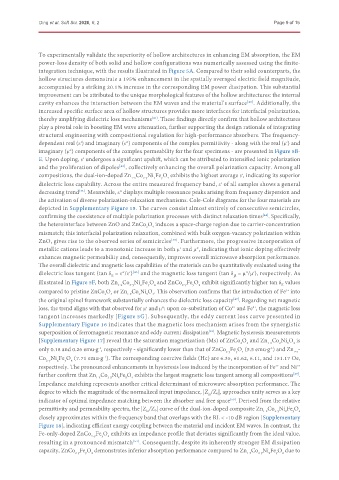
To experimentally validate the superiority of hollow architectures in enhancing EM absorption, the EM
power-loss density of both solid and hollow configurations was numerically assessed using the finite-
integration technique, with the results illustrated in Figure 5A. Compared to their solid counterparts, the
hollow structures demonstrate a 195% enhancement in the spatially averaged electric field magnitude,
accompanied by a striking 20.1% increase in the corresponding EM power dissipation. This substantial
improvement can be attributed to the unique morphological features of the hollow architectures: the internal
cavity enhances the interaction between the EM waves and the material’s surface . Additionally, the
[40]
increased specific surface area of hollow structures provides more interfaces for interfacial polarization,
thereby amplifying dielectric loss mechanisms . These findings directly confirm that hollow architectures
[41]
play a pivotal role in boosting EM wave attenuation, further supporting the design rationale of integrating
structural engineering with compositional regulation for high-performance absorbers. The frequency-
dependent real (ε′) and imaginary (ε″) components of the complex permittivity - along with the real (μ′) and
imaginary (μ″) components of the complex permeability for the four specimens - are presented in Figure 5B-
E. Upon doping, ε′ undergoes a significant upshift, which can be attributed to intensified ionic polarization
and the proliferation of dipoles , collectively enhancing the overall polarization capacity. Among all
[42]
compositions, the dual-ion-doped Zn Co Ni Fe O exhibits the highest average ε′, indicating its superior
2-y
1-x
4
x
y
dielectric loss capability. Across the entire measured frequency band, ε′ of all samples shows a general
decreasing trend . Meanwhile, ε″ displays multiple resonance peaks arising from frequency dispersion and
[43]
the activation of diverse polarization-relaxation mechanisms. Cole-Cole diagrams for the four materials are
depicted in Supplementary Figure 15. The curves consist almost entirely of consecutive semicircles,
confirming the coexistence of multiple polarization processes with distinct relaxation times . Specifically,
[44]
the heterointerface between ZnO and ZnCo O induces a space-charge region due to carrier-concentration
2
4
mismatch; this interfacial polarization relaxation, combined with bulk oxygen-vacancy polarization within
ZnO, gives rise to the observed series of semicircles . Furthermore, the progressive incorporation of
[45]
metallic cations leads to a monotonic increase in both μ′ and μ″, indicating that ionic doping effectively
enhances magnetic permeability and, consequently, improves overall microwave absorption performance.
The overall dielectric and magnetic loss capabilities of the materials can be quantitatively evaluated using the
dielectric loss tangent (tan δ = ε″/ε′) and the magnetic loss tangent (tan δ = μ″/μ′), respectively. As
[46]
μ
ε
illustrated in Figure 5F, both Zn Co Ni Fe O and ZnCo Fe O exhibit significantly higher tan δ values
ε
y
x
4
4
2-y
2-y
y
1-x
compared to pristine ZnCo O or Zn Co Ni O . This observation confirms that the introduction of Fe into
3+
4
2
1-x
4
2
x
the original spinel framework substantially enhances the dielectric loss capacity . Regarding net magnetic
[47]
loss, the trend aligns with that observed for μ′ and μ″: upon co-substitution of Co and Fe , the magnetic loss
2+
3+
tangent increases markedly [Figure 5G]. Subsequently, the eddy current loss curve presented in
Supplementary Figure 16 indicates that the magnetic loss mechanism arises from the synergistic
superposition of ferromagnetic resonance and eddy current dissipation . Magnetic hysteresis measurements
[48]
[Supplementary Figure 17] reveal that the saturation magnetization (Ms) of ZnCo O and Zn Co Ni O is
1-x
4
4
x
2
2
only 0.18 and 0.26 emu·g , respectively - significantly lower than that of ZnCo Fe O (5.5 emu·g ) and Zn -
-1
-1
1‑x
4
2-y
y
Co Ni Fe O (7.71 emu·g ). The corresponding coercive fields (Hc) are 6.35, 61.62, 6.11, and 151.17 Oe,
-1
4
y
2-y
x
respectively. The pronounced enhancements in hysteresis loss induced by the incorporation of Fe and Ni 2+
3+
further confirm that Zn Co Ni Fe O exhibits the largest magnetic loss tangent among all compositions .
[49]
y
4
2-y
x
1-x
Impedance matching represents another critical determinant of microwave absorption performance. The
degree to which the magnitude of the normalized input impedance, |Z /Z 0|, approaches unity serves as a key
in
indicator of optimal impedance matching between the absorber and free space . Derived from the relative
[50]
permittivity and permeability spectra, the |Z /Z 0| curve of the dual-ion-doped composite Zn Co Ni Fe O 4
2-y
1-x
y
x
in
closely approximates within the frequency band that overlaps with the RL < -10 dB region [Supplementary
Figure 18], indicating efficient energy coupling between the material and incident EM waves. In contrast, the
Fe-only-doped ZnCo Fe O exhibits an impedance profile that deviates significantly from the ideal value,
y
2-y
4
resulting in a pronounced mismatch . Consequently, despite its inherently stronger EM dissipation
[51]
capacity, ZnCo Fe O demonstrates inferior absorption performance compared to Zn Co Ni Fe O due to
4
y
2-y
x
y
2-y
1-x
4