
Page 11 - Read Online
P. 11
Page 8 of 15 Romano et al. Soft Sci 2024;4:31 https://dx.doi.org/10.20517/ss.2024.24
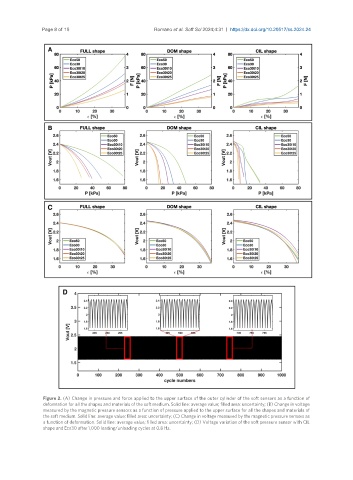
Figure 2. (A) Change in pressure and force applied to the upper surface of the outer cylinder of the soft sensors as a function of
deformation for all the shapes and materials of the soft medium. Solid line: average value; filled area: uncertainty; (B) Change in voltage
measured by the magnetic pressure sensors as a function of pressure applied to the upper surface for all the shapes and materials of
the soft medium. Solid line: average value; filled area: uncertainty; (C) Change in voltage measured by the magnetic pressure sensors as
a function of deformation. Solid line: average value; filled area: uncertainty; (D) Voltage variation of the soft pressure sensor with CIL
shape and Eco30 after 1,000 loading/unloading cycles at 0.8 Hz.