
Page 10 - Read Online
P. 10
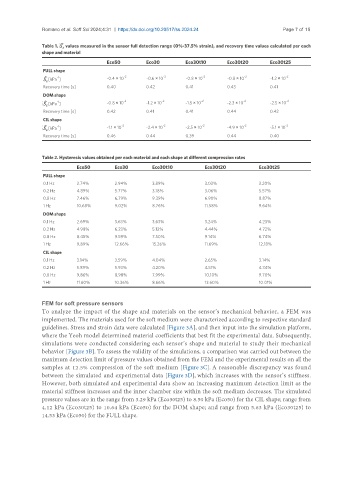
Romano et al. Soft Sci 2024;4:31  https://dx.doi.org/10.20517/ss.2024.24         Page 7 of 15

               Table 1. S  values measured in the sensor full detection range (0%-37.5% strain), and recovery time values calculated per each
                      ε
               shape and material
                                     Eco50        Eco30         Eco30t10      Eco30t20      Eco30t25
                FULL shape
                    -1
                S  [kPa ]            -0.4 × 10 -2  -0.6 × 10 -2  -0.8 × 10 -2  -0.8 × 10 -2  -1.2 × 10 -2
                ε
                Recovery time [s]    0.40         0.42          0.41          0.43          0.41
                DOM shape
                    -1                     -2           -2           -2            -2             -2
                S  [kPa ]            -0.8 × 10    -1.2 × 10     -1.5 × 10     -2.3 × 10     -2.5 × 10
                ε
                Recovery time [s]    0.42         0.41          0.41          0.44          0.42
                CIL shape
                    -1                    -2            -2           -2            -2            -2
                S  [kPa ]            -1.1 × 10    -2.4 × 10     -2.5 × 10     -4.9 × 10     -5.1 × 10
                 ε
                Recovery time [s]    0.46         0.44          0.39          0.44          0.40

               Table 2. Hysteresis values obtained per each material and each shape at different compression rates
                           Eco50        Eco30       Eco30t10          Eco30t20          Eco30t25
                FULL shape
                0.1 Hz     2.74%        2.94%       3.89%             3.03%             3.20%
                0.2 Hz     4.89%        5.77%       3.18%             3.06%             5.57%
                0.8 Hz     7.46%        6.79%       9.39%             6.90%             8.87%
                1 Hz       10.68%       9.02%       8.76%             11.58%            9.64%
                DOM shape
                0.1 Hz     2.69%        3.63%       3.63%             3.24%             4.23%
                0.2 Hz     4.98%        6.23%       5.12%             4.44%             4.72%
                0.8 Hz     8.45%        9.59%       7.50%             9.14%             6.74%
                1 Hz       9.89%        12.66%      15.26%            11.69%            12.18%
                CIL shape
                0.1 Hz     3.14%        3.59%       4.04%             2.65%             3.14%
                0.2 Hz     5.89%        5.93%       4.20%             4.51%             4.34%
                0.8 Hz     9.86%        8.98%       7.99%             10.10%            9.70%
                1 Hz       11.60%       10.36%      8.66%             13.60%            10.01%


               FEM for soft pressure sensors
               To analyze the impact of the shape and materials on the sensor’s mechanical behavior, a FEM was
               implemented. The materials used for the soft medium were characterized according to respective standard
               guidelines. Stress and strain data were calculated [Figure 3A], and then input into the simulation platform,
               where the Yeoh model determined material coefficients that best fit the experimental data. Subsequently,
               simulations were conducted considering each sensor’s shape and material to study their mechanical
               behavior [Figure 3B]. To assess the validity of the simulations, a comparison was carried out between the
               maximum detection limit of pressure values obtained from the FEM and the experimental results on all the
               samples at 12.5% compression of the soft medium [Figure 3C]. A reasonable discrepancy was found
               between the simulated and experimental data [Figure 3D], which increases with the sensor’s stiffness.
               However, both simulated and experimental data show an increasing maximum detection limit as the
               material stiffness increases and the inner chamber size within the soft medium decreases. The simulated
               pressure values are in the range from 3.29 kPa (Eco30t25) to 8.50 kPa (Eco50) for the CIL shape; range from
               4.12 kPa (Eco30t25) to 10.64 kPa (Eco50) for the DOM shape; and range from 5.63 kPa (Eco30t25) to
               14.53 kPa (Eco50) for the FULL shape.