
Page 128 - Read Online
P. 128
Page 14 of 19 Peng et al. Soft Sci. 2025, 5, 38 https://dx.doi.org/10.20517/ss.2025.31
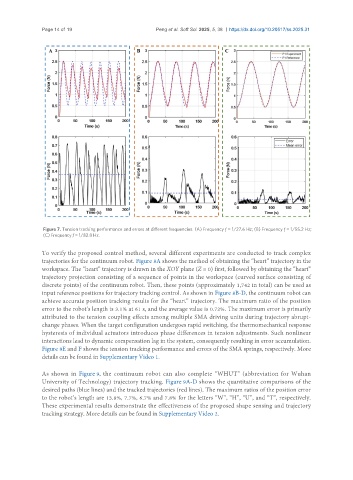
Figure 7. Tension tracking performance and errors at different frequencies. (A) Frequency f = 1/27.6 Hz; (B) Frequency f = 1/55.2 Hz;
(C) Frequency f = 1/82.8 Hz.
To verify the proposed control method, several different experiments are conducted to track complex
trajectories for the continuum robot. Figure 8A shows the method of obtaining the “heart” trajectory in the
workspace. The “heart” trajectory is drawn in the XOY plane (Z = 0) first, followed by obtaining the “heart”
trajectory projection consisting of a sequence of points in the workspace (curved surface consisting of
discrete points) of the continuum robot. Then, these points (approximately 1,742 in total) can be used as
input reference positions for trajectory tracking control. As shown in Figure 8B-D, the continuum robot can
achieve accurate position tracking results for the “heart” trajectory. The maximum ratio of the position
error to the robot’s length is 3.1% at 61 s, and the average value is 0.72%. The maximum error is primarily
attributed to the tension coupling effects among multiple SMA driving units during trajectory abrupt-
change phases. When the target configuration undergoes rapid switching, the thermomechanical response
hysteresis of individual actuators introduces phase differences in tension adjustments. Such nonlinear
interactions lead to dynamic compensation lag in the system, consequently resulting in error accumulation.
Figure 8E and F shows the tension tracking performance and errors of the SMA springs, respectively. More
details can be found in Supplementary Video 1.
As shown in Figure 9, the continuum robot can also complete “WHUT” (abbreviation for Wuhan
University of Technology) trajectory tracking. Figure 9A-D shows the quantitative comparisons of the
desired paths (blue lines) and the tracked trajectories (red lines). The maximum ratios of the position error
to the robot’s length are 13.8%, 7.7%, 6.7% and 7.8% for the letters “W”, “H”, “U”, and “T”, respectively.
These experimental results demonstrate the effectiveness of the proposed shape sensing and trajectory
tracking strategy. More details can be found in Supplementary Video 2.