
Page 124 - Read Online
P. 124
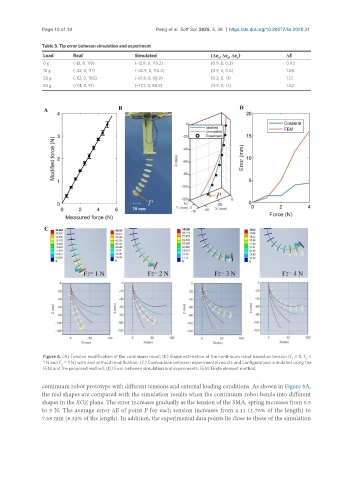
Page 10 of 19                          Peng et al. Soft Sci. 2025, 5, 38  https://dx.doi.org/10.20517/ss.2025.31

               Table 3. Tip error between simulation and experiment
                Load      Real                Simulated                 (Δe , Δe , Δe )           ΔE
                                                                           x
                                                                                 z
                                                                              y
                0 g       (-12, 0, 119)       (-12.9, 0, 119.2)         (0.9, 0, 0.2)             0.92
                10 g      (-42, 0, 111)       (-42.9, 0, 110.4)         (0.9, 0, 0.6)             1.08
                20 g      (-62, 0, 100)       (-61.8, 0, 98.9)          (0.2, 0, 1.1)             1.12
                30 g      (-74, 0, 91)        (-73.1, 0, 88.9)          (0.9, 0, 1.1)             1.42


                Figure 4. (A) Tension modification of the continuum robot; (B) Shape estimation of the continuum robot based on tension (F  = 0, F  =
                                                                                                    1
                                                                                                        2
                1 N and F  = 1 N) with and without modification; (C) Comparison between experimental results and configurations simulated using the
                      3
                FEM and the proposed method; (D) Error between simulation and experiments. FEM: Finite element method.
               continuum robot prototype with different tensions and external loading conditions. As shown in Figure 5A,
               the real shapes are compared with the simulation results when the continuum robot bends into different
               shapes in the XOZ plane. The error increases gradually as the tension of the SMA  spring increases from 0.5
                                                                                    1
               to 5 N. The average error ΔE of point P for each tension increases from 2.11 (1.76% of the length) to
               7.58 mm (6.32% of the length). In addition, the experimental data points lie close to those of the simulation