Page 44 - Read Online
P. 44

Page 8 of 14                                                                                Nakamoto et al. Plast Aesthet Res 2024;11:54     https://dx.doi.org/10.20517/2347-9264.2024.82


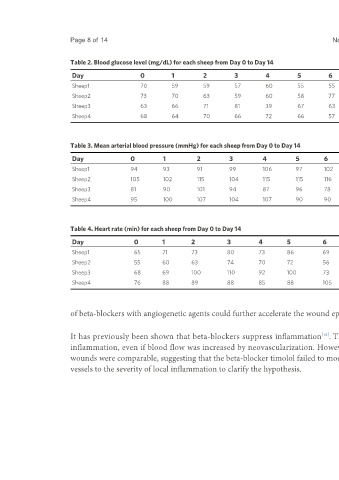
                          Table 2. Blood glucose level (mg/dL) for each sheep from Day 0 to Day 14

                          Day                     0          1          2          3          4          5          6          7          8          9          10         11         12         13         14
                          Sheep1                  70         59         59         57         60         55         55         68         68         69         58         57         75         56         61
                          Sheep2                  73         70         63         59         60         58         77         86         77         68         62         49         69         77         73

                          Sheep3                  63         66         71         81         39         67         63         56         77         61         65         66         63         62         70
                          Sheep4                  68         64         70         66         72         66         57         52         66         62         60         63         64         54         57


                          Table 3. Mean arterial blood pressure (mmHg) for each sheep from Day 0 to Day 14

                          Day                  0          1           2          3           4           5         6          7           8           9           10         11         12        13         14
                          Sheep1               94         93          91         99          106         97        102        97          101         111         94         101        96        101        93

                          Sheep2               105        102         115        104         115         115       116        114         104         111         111        120        119       112        112
                          Sheep3               81         90          101        94          87          96        78         77          95          93          86         91         91        86         95
                          Sheep4               95         100         107        104         107         90        90         100         90          100         105        94         99        93         95


                          Table 4. Heart rate (min) for each sheep from Day 0 to Day 14

                          Day                   0         1         2            3          4         5           6           7           8           9            10          11        12        13        14

                          Sheep1                65        71        73           80         73        86          69          92          95          77           82          87        81        79        61
                          Sheep2                55        60        63           74         70        72          56          74          56          65           72          62        86        57        58
                          Sheep3                68        69        100          110        92        100         73          63          101         91           96          99        95        63        99
                          Sheep4                76        88        89           88         85        88          105         102         103         100          102         72        97        98        95


                          of beta-blockers with angiogenetic agents could further accelerate the wound epithelialization rate.


                                                                                                                  [16]
                          It has previously been shown that beta-blockers suppress inflammation . Therefore, beta-blockers could offset the increased blood flow by suppressing
                          inflammation, even if blood flow was increased by neovascularization. However, in the present study, the numbers of neutrophils and macrophages in the
                          wounds were comparable, suggesting that the beta-blocker timolol failed to modulate inflammation. Future studies should correlate the number of neovascular

                          vessels to the severity of local inflammation to clarify the hypothesis.
   39   40   41   42   43   44   45   46   47   48   49