
Page 41 - Read Online
P. 41
Nakamoto et al. Plast Aesthet Res 2024;11:54 https://dx.doi.org/10.20517/2347-9264.2024.82 Page 5 of 14
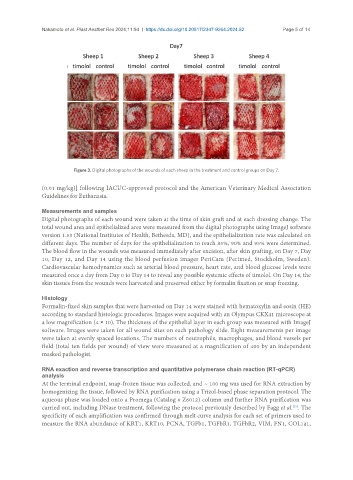
Figure 3. Digital photographs of the wounds of each sheep in the treatment and control groups on Day 7.
(0.01 mg/kg)] following IACUC-approved protocol and the American Veterinary Medical Association
Guidelines for Euthanasia.
Measurements and samples
Digital photographs of each wound were taken at the time of skin graft and at each dressing change. The
total wound area and epithelialized area were measured from the digital photographs using ImageJ software
version 1.53 (National Institutes of Health, Bethesda, MD), and the epithelialization rate was calculated on
different days. The number of days for the epithelialization to reach 85%, 90% and 95% were determined.
The blood flow in the wounds was measured immediately after excision, after skin grafting, on Day 7, Day
10, Day 12, and Day 14 using the blood perfusion imager PeriCam (Perimed, Stockholm, Sweden).
Cardiovascular hemodynamics such as arterial blood pressure, heart rate, and blood glucose levels were
measured once a day from Day 0 to Day 14 to reveal any possible systemic effects of timolol. On Day 14, the
skin tissues from the wounds were harvested and preserved either by formalin fixation or snap freezing.
Histology
Formalin-fixed skin samples that were harvested on Day 14 were stained with hematoxylin and eosin (HE)
according to standard histologic procedures. Images were acquired with an Olympus CKX41 microscope at
a low magnification (4 × 10). The thickness of the epithelial layer in each group was measured with ImageJ
software. Images were taken for all wound sites on each pathology slide. Eight measurements per image
were taken at evenly spaced locations. The numbers of neutrophils, macrophages, and blood vessels per
field (total ten fields per wound) of view were measured at a magnification of 400 by an independent
masked pathologist.
RNA exaction and reverse transcription and quantitative polymerase chain reaction (RT-qPCR)
analysis
At the terminal endpoint, snap-frozen tissue was collected, and ~ 100 mg was used for RNA extraction by
homogenizing the tissue, followed by RNA purification using a Trizol-based phase separation protocol. The
aqueous phase was loaded onto a Promega (Catalog # Z6012) column and further RNA purification was
[15]
carried out, including DNase treatment, following the protocol previously described by Fagg et al. . The
specificity of each amplification was confirmed through melt curve analysis for each set of primers used to
measure the RNA abundance of KRT1, KRT10, PCNA, TGFb1, TGFbR1, TGFbR2, VIM, FN1, COL1a1,