
Page 322 - Read Online
P. 322
Page 8 of 14 Darbinyan et al. Neuroimmunol Neuroinflammation 2018;5:41 I http://dx.doi.org/10.20517/2347-8659.2018.33
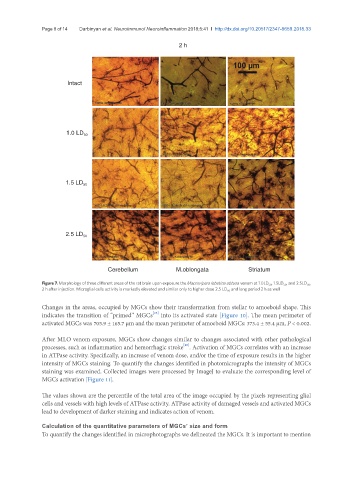
2 h
Intact
1.0 LD 50
1.5 LD 50
2.5 LD 50
Cerebellum M.oblongata Striatum
Figure 7. Morphology of three different areas of the rat brain upon exposure the Macrovipera lebetina obtusa venom at 1.0LD 50 , 1.5LD 50 , and 2.5LD 50 ,
2 h after injection. Microglial cells activity is markedly elevated and similar only to higher dose 2.5 LD 50 and long period 2 h as well
Changes in the areas, occupied by MGCs show their transformation from stellar to amoeboid shape. This
[25]
indicates the transition of “primed” MGCs into its activated state [Figure 10]. The mean perimeter of
activated MGCs was 705.9 ± 165.7 µm and the mean perimeter of amoeboid MGCs: 373.4 ± 55.4 μm, P < 0.002.
After MLO venom exposure, MGCs show changes similar to changes associated with other pathological
[26]
processes, such as inflammation and hemorrhagic stroke . Activation of MGCs correlates with an increase
in ATPase activity. Specifically, an increase of venom dose, and/or the time of exposure results in the higher
intensity of MGCs staining. To quantify the changes identified in photomicrographs the intensity of MGCs
staining was examined. Collected images were processed by ImageJ to evaluate the corresponding level of
MGCs activation [Figure 11].
The values shown are the percentile of the total area of the image occupied by the pixels representing glial
cells and vessels with high levels of ATPase activity. ATPase activity of damaged vessels and activated MGCs
lead to development of darker staining and indicates action of venom.
Calculation of the quantitative parameters of MGCs’ size and form
To quantify the changes identified in microphotographs we delineated the MGCs. It is important to mention