
Page 326 - Read Online
P. 326
Page 12 of 14 Darbinyan et al. Neuroimmunol Neuroinflammation 2018;5:41 I http://dx.doi.org/10.20517/2347-8659.2018.33
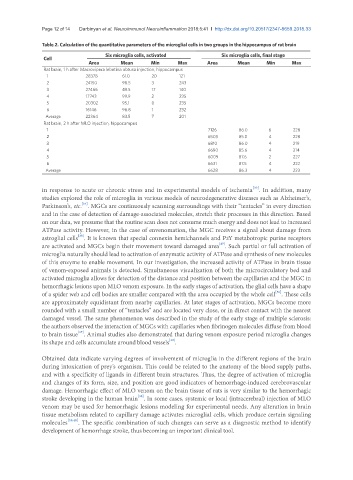
Table 2. Calculation of the quantitative parameters of the microglial cells in two groups in the hippocampus of rat brain
Six microglia cells, activated Six microglia cells, final stage
Cell
Area Mean Min Max Area Mean Min Max
Rat brain, 1 h after Macrovipera lebetina obtusa injection, hippocampus
1 28378 61.0 20 121
2 24150 98.5 3 243
3 27466 49.5 17 140
4 17743 99.9 2 235
5 20302 95.1 0 235
6 16146 96.8 1 232
Average 22364 83.5 7 201
Rat brain, 2 h after MLO injection, hippocampus
1 7126 86.0 6 228
2 6503 85.0 4 228
3 6810 86.0 4 219
4 6690 85.6 4 214
5 6009 87.6 2 227
6 6631 87.5 4 222
Average 6628 86.3 4 223
[33]
in response to acute or chronic stress and in experimental models of ischemia . In addition, many
studies explored the role of microglia in various models of neurodegenerative diseases such as Alzheimer’s,
[34]
Parkinson’s, etc. . MGCs are continuously scanning surroundings with their “tentacles” in every direction
and in the case of detection of damage-associated molecules, stretch their processes in this direction. Based
on our data, we presume that the routine scan does not consume much energy and does not lead to increased
ATPase activity. However, in the case of envenomation, the MGC receives a signal about damage from
[35]
astroglial cells . It is known that special connexin hemichannels and P2Y metabotropic purine receptors
[27]
are activated and MGCs begin their movement toward damaged area . Such partial or full activation of
microglia naturally should lead to activation of enzymatic activity of ATPase and synthesis of new molecules
of this enzyme to enable movement. In our investigation, the increased activity of ATPase in brain tissue
of venom-exposed animals is detected. Simultaneous visualization of both the microcirculatory bed and
activated microglia allows for detection of the distance and position between the capillaries and the MGC in
hemorrhagic lesions upon MLO venom exposure. In the early stages of activation, the glial cells have a shape
[36]
of a spider web and cell bodies are smaller compared with the area occupied by the whole cell . These cells
are approximately equidistant from nearby capillaries. At later stages of activation, MGCs become more
rounded with a small number of “tentacles” and are located very close, or in direct contact with the nearest
damaged vessel. The same phenomenon was described in the study of the early stage of multiple sclerosis:
the authors observed the interaction of MGCs with capillaries when fibrinogen molecules diffuse from blood
[37]
to brain tissue . Animal studies also demonstrated that during venom exposure period microglia changes
[32]
its shape and cells accumulate around blood vessels .
Obtained data indicate varying degrees of involvement of microglia in the different regions of the brain
during intoxication of prey’s organism. This could be related to the anatomy of the blood supply paths,
and with a specificity of ligands in different brain structures. Thus, the degree of activation of microglia
and changes of its form, size, and position are good indicators of hemorrhage-induced cerebrovascular
damage. Hemorrhagic effect of MLO venom on the brain tissue of rats is very similar to the hemorrhagic
[38]
stroke developing in the human brain . In some cases, systemic or local (intracerebral) injection of MLO
venom may be used for hemorrhagic lesions modeling for experimental needs. Any alteration in brain
tissue metabolism related to capillary damage activates microglial cells, which produce certain signaling
molecules [39,40] . The specific combination of such changes can serve as a diagnostic method to identify
development of hemorrhage stroke, thus becoming an important clinical tool.