
Page 321 - Read Online
P. 321
Darbinyan et al. Neuroimmunol Neuroinflammation 2018;5:41 I http://dx.doi.org/10.20517/2347-8659.2018.33 Page 7 of 14
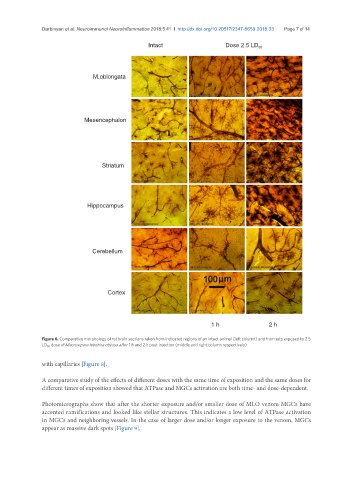
Intact Dose 2.5 LD 50
M.oblongata
Mesencephalon
Striatum
Hippocampus
Cerebellum
Cortex
1 h 2 h
Figure 6. Comparative morphology of rat brain sections taken from indicated regions of an intact animal (left column) and from rats exposed to 2.5
LD 50 dose of Macrovipera lebetina obtusa after 1 h and 2 h post injection (middle and right column respectively)
with capillaries [Figure 8].
A comparative study of the effects of different doses with the same time of exposition and the same doses for
different times of exposition showed that ATPase and MGCs activation are both time- and dose-dependent.
Photomicrographs show that after the shorter exposure and/or smaller dose of MLO venom MGCs have
accented ramifications and looked like stellar structures. This indicates a low level of ATPase activation
in MGCs and neighboring vessels. In the case of larger dose and/or longer exposure to the venom, MGCs
appear as massive dark spots [Figure 9].