
Page 325 - Read Online
P. 325
Darbinyan et al. Neuroimmunol Neuroinflammation 2018;5:41 I http://dx.doi.org/10.20517/2347-8659.2018.33 Page 11 of 14
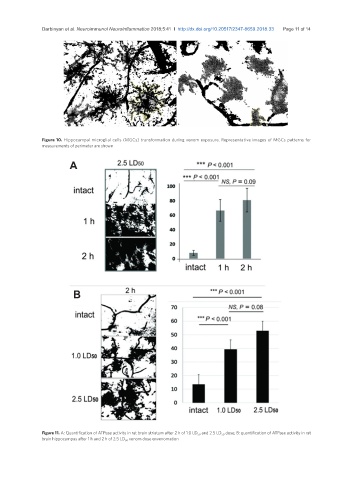
Figure 10. Hippocampal microglial cells (MGCs) transformation during venom exposure. Representative images of MGCs patterns for
measurements of perimeter are shown
A
B
Figure 11. A: Quantification of ATPase activity in rat brain striatum after 2 h of 1.0 LD 50 and 2.5 LD 50 dose; B: quantification of ATPase activity in rat
brain hippocampus after 1 h and 2 h of 2.5 LD 50 venom dose envenomation