
Page 318 - Read Online
P. 318
Page 4 of 14 Darbinyan et al. Neuroimmunol Neuroinflammation 2018;5:41 I http://dx.doi.org/10.20517/2347-8659.2018.33
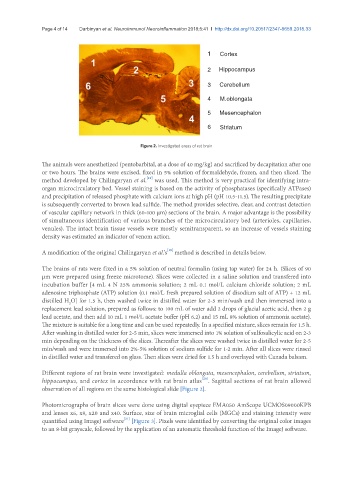
1 Cortex
2 Hippocampus
3 Cerebellum
4 M.oblongata
5 Mesencephalon
6 Striatum
Figure 2. Investigated areas of rat brain
The animals were anesthetized (pentobarbital, at a dose of 40 mg/kg) and sacrificed by decapitation after one
or two hours. The brains were excised, fixed in 5% solution of formaldehyde, frozen, and then sliced. The
[19]
method developed by Chilingaryan et al. was used. This method is very practical for identifying intra-
organ microcirculatory bed. Vessel staining is based on the activity of phosphatases (specifically ATPases)
and precipitation of released phosphate with calcium ions at high pH (pH 10.5-11.5). The resulting precipitate
is subsequently converted to brown lead sulfide. The method provides selective, clear, and contrast detection
of vascular capillary network in thick (60-100 µm) sections of the brain. A major advantage is the possibility
of simultaneous identification of various branches of the microcirculatory bed (arterioles, capillaries,
venules). The intact brain tissue vessels were mostly semitransparent, so an increase of vessels staining
density was estimated an indicator of venom action.
A modification of the original Chilingaryan et al.’s method is described in details below.
[19]
The brains of rats were fixed in a 5% solution of neutral formalin (using tap water) for 24 h. (Slices of 90
µm were prepared using freeze microtome). Slices were collected in a saline solution and transfered into
incubation buffer [4 mL 4 N 25% ammonia solution; 2 mL 0.1 mol/L calcium chloride solution; 2 mL
adenosine triphosphate (ATP) solution (0.1 mol/L fresh prepared solution of disodium salt of ATP) + 12 mL
distilled H O] for 1.5 h, then washed twice in distilled water for 2-5 min/wash and then immersed into a
2
replacement lead solution, prepared as follows: to 100 mL of water add 2 drops of glacial acetic acid, then 2 g
lead acetate, and then add 10 mL 1 mol/L acetate buffer (pH 6.2) and 15 mL 8% solution of ammonia acetate).
The mixture is suitable for a long time and can be used repeatedly. In a specified mixture, slices remain for 1.5 h.
After washing in distilled water for 2-5 min, slices were immersed into 1% solution of sulfosalicylic acid on 2-3
min depending on the thickness of the slices. Thereafter the slices were washed twice in distilled water for 2-5
min/wash and were immersed into 2%-5% solution of sodium sulfide for 1-2 min. After all slices were rinsed
in distilled water and transfered on glass. Then slices were dried for 1.5 h and overlayed with Canada balsam.
Different regions of rat brain were investigated: medulla oblongata, mesencephalon, cerebellum, striatum,
hippocampus, and cortex in accordance with rat brain atlas . Sagittal sections of rat brain allowed
[20]
observation of all regions on the same histological slide [Figure 2].
Photomicrographs of brain slices were done using digital eyepiece FMA050 AmScope UCMOS09000KPB
and lenses x6, x9, x20 and x40. Surface, size of brain microglial cells (MGCs) and staining intensity were
[21]
quantified using ImageJ software [Figure 3]. Pixels were identified by converting the original color images
to an 8-bit grayscale, followed by the application of an automatic threshold function of the ImageJ software.