


Page 76 - Read Online
P. 76
Cheng et al. J. Mater. Inf. 2025, 5, 53  https://dx.doi.org/10.20517/jmi.2025.61  Page 9 of 17


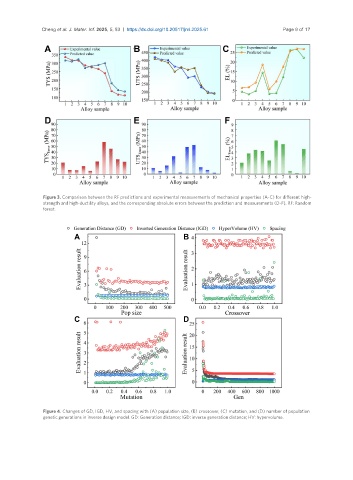
                Figure 3. Comparison between the RF predictions and experimental measurements of mechanical properties (A-C) for different high-
                strength and high-ductility alloys, and the corresponding absolute errors between the prediction and measurements (D-F). RF: Random
                forest.


                Figure 4. Changes of GD, IGD, HV, and spacing with (A) population size, (B) crossover, (C) mutation, and (D) number of population
                genetic generations in inverse design model. GD: Generation distance; IGD: inverse generation distance; HV: hypervolume.

