


Page 73 - Read Online
P. 73
Page 6 of 17                       Cheng et al. J. Mater. Inf. 2025, 5, 53  https://dx.doi.org/10.20517/jmi.2025.61

               RESULTS AND DISCUSSION
               Forward model
               To establish the optimal regression model for TYS, UTS, and EL of Mg-Gd-based alloys, four different ML
               algorithms - SVR, ANN, RF, and XGBoost - were implemented based on Python 3.9 using Scikit-learn and
               xgboost ML open-source libraries. The predictive capability of different ML algorithms was evaluated using
               the coefficient of determination (R ) and the mean absolute error (MAE). In the modeling process,
                                               2
               standardization was employed to scale the dataset and eliminate the effect of numerical differences on the
               predictions. In addition, to ensure the robust model evaluation, the effects of data division and algorithm
               hyperparameters on prediction errors were considered, and a five-fold cross-validation protocol was
               implemented for the optimization of model parameters.


               To evaluate the predictive capability of different ML algorithms, Figure 2 compares the predicted and actual
               values of TYS, UTS, and EL for Mg-Gd and Mg-Y-based alloys within both training and testing datasets.
               The R  and MAE values are presented in Table 2. For TYS, both RF and XGBoost exhibit comparable high
                    2
                2
               R  values, while RF achieves a lower prediction error on the test set (MAE = 21.0 MPa). For UTS prediction,
               RF markedly outperforms the other three algorithms on the test set, achieving R  = 0.90 and MAE =
                                                                                        2
               16.5 MPa. In addition, RF demonstrates good predictive capability for EL, with R  = 0.84 and MAE = 3.2%,
                                                                                    2
               demonstrating its ability to effectively quantify EL within the investigated parameter space. Thus, the RF
               algorithm effectively captures the relationship between chemical composition and mechanical properties of
               Mg-Gd and Mg-Y-based alloys and is used to construct the forward model of TYS, UTS, and EL.


               To further verify the predictive ability of the RF model, ten different Mg-Gd-based alloys were prepared and
               tested for tensile mechanical properties. The chemical compositions and processing parameters are shown
               in Table 3. It should be noted that the selected alloys span a wide range of compositional and processing
               conditions to ensure representative validation samples. To compare with experimental measurements, the
               TYS, UTS, and EL are predicted using the established RF forward model with the parameters listed in
               Table 3. Figure 3A-C compares the experimentally measured TYS, UTS, and EL with the predictions from
               the RF forward model for various high-strength and high-ductility alloys, demonstrating strong agreement
               between predicted and measured mechanical properties of Mg-Gd-based alloys. The absolute prediction
               errors of the RF forward model are illustrated in Figure 3D-F. Specifically, the predictive discrepancies for
               UTS and TYS are less than 30 MPa for most alloys, while the prediction error for EL is mainly below 4%. On
               average, the prediction discrepancies of TYS, UTS, and EL are 23.5 MPa (~9.8%), 19.0 MPa (~6.0%), and
               3.3%, respectively. Although a few samples exhibit slightly larger deviations, the errors are randomly
               distributed across all test cases, without evident bias toward specific compositional or processing conditions.
               It suggests that the RF model maintains robust predictive stability and generalizability across different
               regions of the input feature space.


               Inverse model
               In accordance with the inverse design framework described in Figure 1, the inverse design model was
               established by integrating the forward model based on RF algorithm and NSGA-II model in Python 3.9
               relying on Geatpy2.7 evolutionary algorithm open-source tool. Considering the strong correlation between
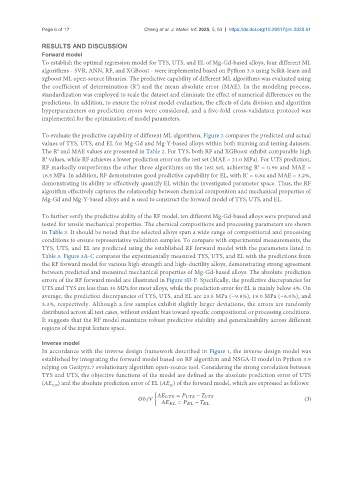
               TYS and UTS, the objective functions of the model are defined as the absolute prediction error of UTS
               (AE ) and the absolute prediction error of EL (AE ) of the forward model, which are expressed as follows:
                                                          EL
                  UTS
                                                     {
                                                                  =           −
                                                                                                        (3)
= − 

