


Page 79 - Read Online
P. 79
Page 12 of 17                      Cheng et al. J. Mater. Inf. 2025, 5, 53  https://dx.doi.org/10.20517/jmi.2025.61

               Table 5. The expanded decision space used for the inverse design of high-performance Mg-Gd-based alloys
                                     Composition (wt.%)                    Processing parameters
                Range
                           Gd       Y      Zn       Mn        ST (°C)      St (h)     ET (°C)       ER
                Min        0        0      0        0         400          5          290           5
                Max        15       7      4        2         560          30         460           40
               ST: Solid solution temperature; St: solid solution time; ET: extrusion temperature; ER: extrusion ratio.


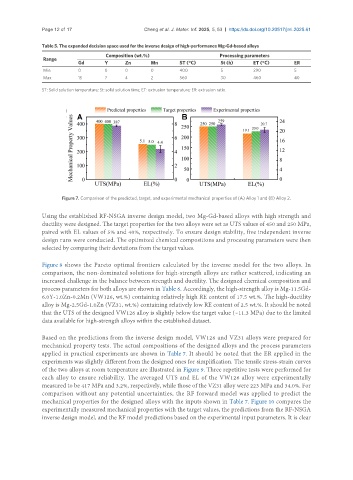
                      Figure 7. Comparison of the predicted, target, and experimental mechanical properties of (A) Alloy 1 and (B) Alloy 2.


               Using the established RF-NSGA inverse design model, two Mg-Gd-based alloys with high strength and
               ductility were designed. The target properties for the two alloys were set as UTS values of 450 and 250 MPa,
               paired with EL values of 5% and 40%, respectively. To ensure design stability, five independent inverse
               design runs were conducted. The optimized chemical compositions and processing parameters were then
               selected by comparing their deviations from the target values.


               Figure 8 shows the Pareto optimal frontiers calculated by the inverse model for the two alloys. In
               comparison, the non-dominated solutions for high-strength alloys are rather scattered, indicating an
               increased challenge in the balance between strength and ductility. The designed chemical composition and
               process parameters for both alloys are shown in Table 6. Accordingly, the high-strength alloy is Mg-11.5Gd-
               6.0Y-1.0Zn-0.2Mn (VW126, wt.%) containing relatively high RE content of 17.5 wt.%. The high-ductility
               alloy is Mg-2.5Gd-1.0Zn (VZ31, wt.%) containing relatively low RE content of 2.5 wt.%. It should be noted
               that the UTS of the designed VW126 alloy is slightly below the target value (~11.3 MPa) due to the limited
               data available for high-strength alloys within the established dataset.

               Based on the predictions from the inverse design model, VW126 and VZ31 alloys were prepared for
               mechanical property tests. The actual compositions of the designed alloys and the process parameters
               applied in practical experiments are shown in Table 7. It should be noted that the ER applied in the
               experiments was slightly different from the designed ones for simplification. The tensile stress-strain curves
               of the two alloys at room temperature are illustrated in Figure 9. Three repetitive tests were performed for
               each alloy to ensure reliability. The averaged UTS and EL of the VW126 alloy were experimentally
               measured to be 417 MPa and 3.2%, respectively, while those of the VZ31 alloy were 223 MPa and 34.0%. For
               comparison without any potential uncertainties, the RF forward model was applied to predict the
               mechanical properties for the designed alloys with the inputs shown in Table 7. Figure 10 compares the
               experimentally measured mechanical properties with the target values, the predictions from the RF-NSGA
               inverse design model, and the RF model predictions based on the experimental input parameters. It is clear

