


Page 80 - Read Online
P. 80
Cheng et al. J. Mater. Inf. 2025, 5, 53  https://dx.doi.org/10.20517/jmi.2025.61  Page 13 of 17

               Table 6. Prediction of the compositions, process parameters, and mechanical properties of high-performance Mg-Gd-based alloys
               from the inverse design model
                          Composition (wt.%)     Processing parameters      Predicted          Target
                Alloy
                       Gd   Y    Zn   Mn    ST (°C)  St (h)  ET (°C)  ER  UTS/MPa  EL/%  UTS/MPa    EL/%
                VW126  11.5  6.0  1.1  0.2  512     12     400     13  438.7      6.8    450        5
                VZ31   2.5  0.0  0.9  0.0   547     13     410     28  250.1      40.0   250        40

               ST: Solid solution temperature; St: solid solution time; ET: extrusion temperature; ER: extrusion ratio; UTS: ultimate tensile strength; EL: elongation.


               Table 7. Chemical composition and processing parameters applied practically in the experiments
                                     Composition (wt.%)                    Processing parameters
                Alloy
                            Gd      Y        Zn      Mn       ST (°C)       St (h)    ET (°C)       ER
                VW126       11.4    6.2      1.2     0.3      515           12        400           10
                VZ31        2.7     0.0      0.9     0.0      545           13        410           25

               ST: Solid solution temperature; St: solid solution time; ET: extrusion temperature; ER: extrusion ratio.


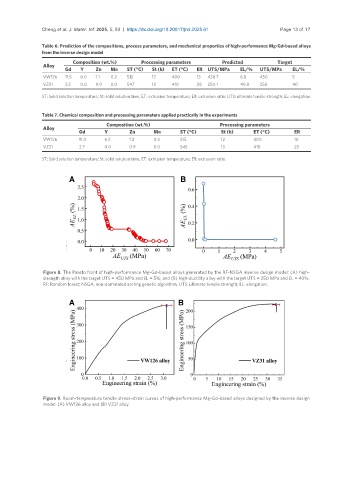
                Figure 8. The Pareto front of high-performance Mg-Gd-based alloys generated by the RF-NSGA inverse design model: (A) high-
                strength alloy with the target UTS = 450 MPa and EL = 5%; and (B) high-ductility alloy with the target UTS = 250 MPa and EL = 40%.
                RF: Random forest; NSGA: non-dominated sorting genetic algorithm; UTS: ultimate tensile strength; EL: elongation.


                Figure 9. Room-temperature tensile stress-strain curves of high-performance Mg-Gd-based alloys designed by the inverse design
                model: (A) VW126 alloy and (B) VZ31 alloy.

