


Page 255 - Read Online
P. 255
Page 20 of 29                                                      Liu et al. J. Mater. Inf. 2026, 6, 18


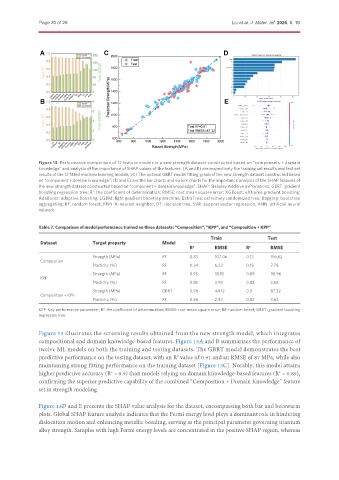
               Figure 13. Performance comparison of 12 feature models in a new strength dataset constructed based on “components + domain
               knowledge” and analysis of the importance of SHAP values of the features. (A and B) are respectively the training set results and test set
               results of the 12 fitted machine learning models; (C) The optimal GBRT model fitting graph of the new strength dataset constructed based
               on “component + domain knowledge”; (D and E) are the bar charts and swarm charts for the importance analysis of the SHAP features of
               the new strength dataset constructed based on “component + domain knowledge”. SHAP: SHapley Additive exPlanations; GBRT: gradient
               boosting regression tree; R : the coefficient of determination; RMSE: root mean square error; XGBoost: eXtreme gradient boosting;
                                  2
               AdaBoost: adaptive boosting; LGBM: light gradient boosting machine; ExtraTree: extremely randomized tree; Bagging: bootstrap
               aggregating; RF: random forest; KNN: K-nearest neighbor; DT: decision tree; SVR: support vector regression; ANN: artificial neural
               network.

               Table 7. Comparison of model performance trained on three datasets: “Composition”, “KPP”, and “Composition + KPP”

                                                                           Train               Test
               Dataset            Target property         Model
                                                                    R 2     RMSE       R 2      RMSE
                                  Strength (MPa)          RF        0.83    107.06     0.12     156.62
               Composition
                                  Plasticity (%)          RF        0.34    6.22       0.18     7.78
                                  Strength (MPa)          RF        0.95    51.85      0.89     98.96
               KPP
                                  Plasticity (%)          RF        0.85    2.95       0.82     3.63
                                  Strength (MPa)          GBRT      0.96    44.12      0.9      87.32
               Composition + KPP
                                  Plasticity (%)          RF        0.86    2.92       0.82     3.63
               KPP: Key performance parameter; R : the coefficient of determination; RMSE: root mean square error; RF: random forest; GBRT: gradient boosting
                                     2
               regression tree.

               Figure 13 illustrates the screening results obtained from the new strength model, which integrates
               compositional and domain knowledge-based features. Figure 13A and B summarizes the performance of
               twelve ML models on both the training and testing datasets. The GBRT model demonstrates the best
               predictive performance on the testing dataset, with an R  value of 0.91 and an RMSE of 87 MPa, while also
                                                               2
               maintaining strong fitting performance on the training dataset [Figure 13C]. Notably, this model attains
               higher predictive accuracy (R  > 0.9) than models relying on domain knowledge-based features (R  = 0.89),
                                        2
                                                                                                   2
               confirming the superior predictive capability of the combined “Composition + Domain Knowledge” feature
               set in strength modeling.

               Figure 13D and E presents the SHAP value analysis for the dataset, encompassing both bar and beeswarm
               plots. Global SHAP feature analysis indicates that the Fermi energy level plays a dominant role in hindering
               dislocation motion and enhancing metallic bonding, serving as the principal parameter governing titanium
               alloy strength. Samples with high Fermi energy levels are concentrated in the positive SHAP region, whereas

