


Page 260 - Read Online
P. 260
Liu et al. J. Mater. Inf. 2026, 6, 18                                                                                              Page 25 of 29


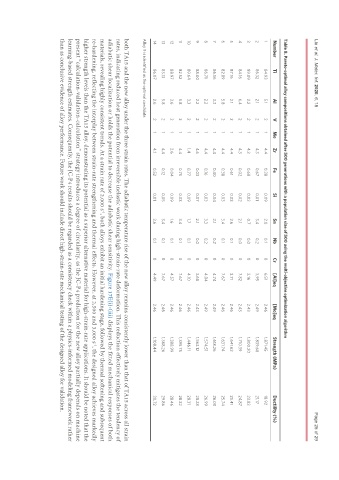
               Table 8. Pareto-optimal alloy compositions obtained after 500 generations with a population size of 500 using the multi-objective optimization algorithm
               Number    Ti         Al    V    Mo    Zr     Fe       Si       Sn    Nb     Cr    [Al]eq     [Mo]eq     Strength (MPa)       Ductility (%)

               1         84.93      5.1   2    1     4.4    0.38     0.09     2.0   0.1    0     6.51       2.46       1,871.45             18.92
               2         86.32      2.1   2    1     4.3    0.67     0.01     3.4   0.2    0     3.95       2.49       1,839.68             21.17
               3         89.09      2.2   2    1     4.3    0.68     0.03     0.7   0.0    0     3.16       2.43       1,800.20             23.83
               4         84.16      6.4   2    1     4.3    0.02     0.02     2.1   0.0    0     7.82       2.43       1,710.39             24.87
               5         87.16      2.1   2    1     4.4    0.61     0.03     2.6   0.1    0     3.71       2.46       1,641.62             25.41
               6         82.89      5.8   2    1     4.4    0.38     0.03     3.4   0.1    0     7.67       2.46       1,631.74             25.74
               7         86.56      3.3   2    1     4.4    0.40     0.04     2.1   0.2    0     4.74       2.49       1,618.26             26.00
               8         86.71      2.2   2    1     4.4    0.16     0.03     3.3   0.2    0     4.04       2.49       1,574.51             26.99
               9         88.00      2.2   2    1     4.6    0.03     0.07     2.1   0.0    0     3.68       2.43       1,563.12             28.28
               10        89.64      3.3   2    1     1.4    0.77     0.09     1.7   0.1    0     4.10       2.46       1,446.11             28.31
               11        82.52      5.8   2    1     4.4    0.75     0.03     3.4   0.1    0     7.67       2.46       1,395.75             28.32
               12        88.97      3.6   2    1     2.6    0.04     0.09     1.6   0.1    0     4.57       2.46       1,388.99             28.46
               13        83.13      5.8   2    1     4.4    0.12     0.05     3.4   0.1    0     7.67       2.46       1,368.26             29.86
               14        86.07      2.6   2    1     4.1    0.52     0.01     3.6   0.1    0     4.49       2.46       1,108.44             30.72
               Alloy 9 is identified as the optimal candidate.


               both TA15 and the new alloy under the three strain rates. The adiabatic temperature rise of the new alloy remains consistently lower than that of TA15 across all strain
               rates, indicating reduced heat generation from irreversible inelastic work during high-strain-rate deformation. This reduction effectively mitigates the tendency of
               adiabatic shear localization or holds the potential to decrease the adiabatic shear sensitivity. Figure 17E(i)-(iii) displays the fitted mechanical responses of both
               materials, revealing highly consistent trends. At a strain rate of 2,000 s , both alloys exhibit an initial hardening stage, followed by thermal softening and subsequent
                                                                           -1
               re-hardening, reflecting the interplay between strain-rate strengthening and thermal effects. However, at 2,500 and 3,000 s , the designed alloy achieves markedly
                                                                                                                         -1
               higher strength levels than the TA15 alloy, demonstrating its potential as a superior alternative material for high-strain-rate applications. It should be noted that the
               present “calculation-validation-calculation” strategy introduces a degree of circularity, as the JC-P4 prediction for the new alloy partially depends on machine
               learning-based strength estimates. Consequently, the JC-P4 results should be regarded as a consistency check within a physics-informed modeling framework rather
               than as conclusive evidence of alloy performance. Future work should include direct high-strain-rate mechanical testing of the designed alloy for validation.

