


Page 258 - Read Online
P. 258
Liu et al. J. Mater. Inf. 2026, 6, 18                                            Page 23 of 29


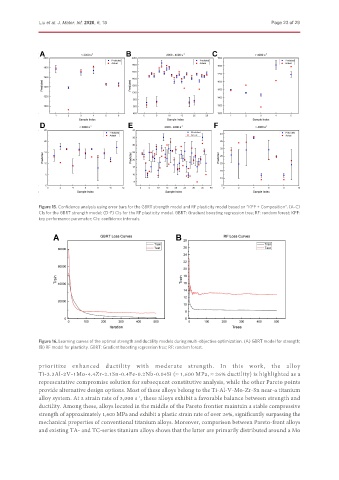
               Figure 15. Confidence analysis using error bars for the GBRT strength model and RF plasticity model based on “KPP + Composition”. (A-C)
               CIs for the GBRT strength model; (D-F) CIs for the RF plasticity model. GBRT: Gradient boosting regression tree; RF: random forest; KPP:
               key performance parameter; CIs: confidence intervals.


               Figure 16. Learning curves of the optimal strength and ductility models during multi-objective optimization. (A) GBRT model for strength;
               (B) RF model for plasticity. GBRT: Gradient boosting regression tree; RF: random forest.

               prioritize   enhanced   ductility   with   moderate   strength.   In   this   work,   the   alloy
               Ti-3.3Al-2V-1Mo-4.4Zr-2.1Sn-0.4Fe-0.2Nb-0.04Si (≈ 1,600 MPa, ≈ 26% ductility) is highlighted as a
               representative compromise solution for subsequent constitutive analysis, while the other Pareto points
               provide alternative design options. Most of these alloys belong to the Ti-Al-V-Mo-Zr-Sn near-α titanium
               alloy system. At a strain rate of 3,000 s , these alloys exhibit a favorable balance between strength and
                                                 -1
               ductility. Among these, alloys located in the middle of the Pareto frontier maintain a stable compressive
               strength of approximately 1,600 MPa and exhibit a plastic strain rate of over 26%, significantly surpassing the
               mechanical properties of conventional titanium alloys. Moreover, comparison between Pareto-front alloys
               and existing TA- and TC-series titanium alloys shows that the latter are primarily distributed around a Mo

