


Page 256 - Read Online
P. 256
Liu et al. J. Mater. Inf. 2026, 6, 18                                            Page 21 of 29


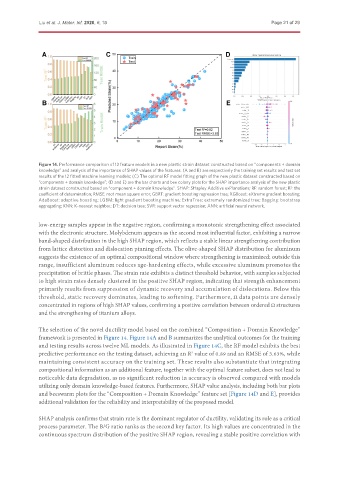
               Figure 14. Performance comparison of 12 feature models in a new plastic strain dataset constructed based on “components + domain
               knowledge” and analysis of the importance of SHAP values of the features. (A and B) are respectively the training set results and test set
               results of the 12 fitted machine learning models; (C) The optimal RF model fitting graph of the new plastic dataset constructed based on
               “components + domain knowledge”; (D and E) are the bar charts and bee colony plots for the SHAP importance analysis of the new plastic
               strain dataset constructed based on “component + domain knowledge”. SHAP: SHapley Additive exPlanations; RF: random forest; R : the
                                                                                                       2
               coefficient of determination; RMSE: root mean square error; GBRT: gradient boosting regression tree; XGBoost: eXtreme gradient boosting;
               AdaBoost: adaptive boosting; LGBM: light gradient boosting machine; ExtraTree: extremely randomized tree; Bagging: bootstrap
               aggregating; KNN: K-nearest neighbor; DT: decision tree; SVR: support vector regression; ANN: artificial neural network.

               low-energy samples appear in the negative region, confirming a monotonic strengthening effect associated
               with the electronic structure. Molybdenum appears as the second most influential factor, exhibiting a narrow
               band-shaped distribution in the high SHAP region, which reflects a stable linear strengthening contribution
               from lattice distortion and dislocation pinning effects. The olive-shaped SHAP distribution for aluminum
               suggests the existence of an optimal compositional window where strengthening is maximized; outside this
               range, insufficient aluminum reduces age-hardening effects, while excessive aluminum promotes the
               precipitation of brittle phases. The strain rate exhibits a distinct threshold behavior, with samples subjected
               to high strain rates densely clustered in the positive SHAP region, indicating that strength enhancement
               primarily results from suppression of dynamic recovery and accumulation of dislocations. Below this
               threshold, static recovery dominates, leading to softening. Furthermore, Ω data points are densely
               concentrated in regions of high SHAP values, confirming a positive correlation between ordered Ω structures
               and the strengthening of titanium alloys.

               The selection of the novel ductility model based on the combined “Composition + Domain Knowledge”
               framework is presented in Figure 14. Figure 14A and B summarizes the analytical outcomes for the training
               and testing results across twelve ML models. As illustrated in Figure 14C, the RF model exhibits the best
               predictive performance on the testing dataset, achieving an R  value of 0.89 and an RMSE of 3.63%, while
                                                                    2
               maintaining consistent accuracy on the training set. These results also substantiate that integrating
               compositional information as an additional feature, together with the optimal feature subset, does not lead to
               noticeable data degradation, as no significant reduction in accuracy is observed compared with models
               utilizing only domain knowledge-based features. Furthermore, SHAP value analysis, including both bar plots
               and beeswarm plots for the “Composition + Domain Knowledge” feature set [Figure 14D and E], provides
               additional validation for the reliability and interpretability of the proposed model.


               SHAP analysis confirms that strain rate is the dominant regulator of ductility, validating its role as a critical
               process parameter. The B/G ratio ranks as the second key factor. Its high values are concentrated in the
               continuous spectrum distribution of the positive SHAP region, revealing a stable positive correlation with

