


Page 252 - Read Online
P. 252
Liu et al. J. Mater. Inf. 2026, 6, 18                                            Page 17 of 29


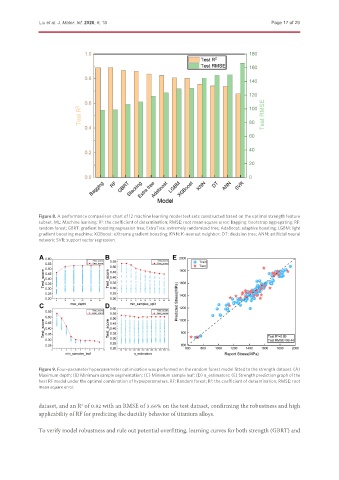
               Figure 8. A performance comparison chart of 12 machine learning model test sets constructed based on the optimal strength feature
               subset. ML: Machine learning; R : the coefficient of determination; RMSE: root mean square error; Bagging: bootstrap aggregating; RF:
                                     2
               random forest; GBRT: gradient boosting regression tree; ExtraTree: extremely randomized tree; AdaBoost: adaptive boosting; LGBM: light
               gradient boosting machine; XGBoost: eXtreme gradient boosting; KNN: K-nearest neighbor; DT: decision tree; ANN: artificial neural
               network; SVR: support vector regression.


               Figure 9. Four-parameter hyperparameter optimization was performed on the random forest model fitted to the strength dataset. (A)
               Maximum depth; (B) Minimum sample segmentation; (C) Minimum sample leaf; (D) n_estimators; (E) Strength prediction graph of the
               best RF model under the optimal combination of hyperparameters. RF: Random forest; R : the coefficient of determination; RMSE: root
                                                                           2
               mean square error.

               dataset, and an R  of 0.82 with an RMSE of 3.66% on the test dataset, confirming the robustness and high
                              2
               applicability of RF for predicting the ductility behavior of titanium alloys.

               To verify model robustness and rule out potential overfitting, learning curves for both strength (GBRT) and

