


Page 250 - Read Online
P. 250
Liu et al. J. Mater. Inf. 2026, 6, 18                                            Page 15 of 29


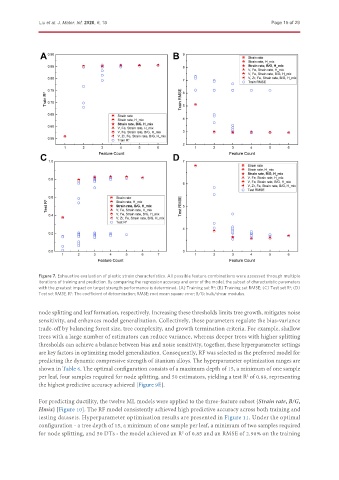
               Figure 7. Exhaustive evaluation of plastic strain characteristics. All possible feature combinations were assessed through multiple
               iterations of training and prediction. By comparing the regression accuracy and error of the model, the subset of characteristic parameters
               with the greatest impact on target strength performance is determined. (A) Training set R ; (B) Training set RMSE; (C) Test set R ; (D)
                                                                                                       2
                                                                            2
               Test set RMSE. R : The coefficient of determination; RMSE: root mean square error; B/G: bulk/shear modulus.
                          2
               node splitting and leaf formation, respectively. Increasing these thresholds limits tree growth, mitigates noise
               sensitivity, and enhances model generalization. Collectively, these parameters regulate the bias-variance
               trade-off by balancing forest size, tree complexity, and growth termination criteria. For example, shallow
               trees with a large number of estimators can reduce variance, whereas deeper trees with higher splitting
               thresholds can achieve a balance between bias and noise sensitivity, together, these hyperparameter settings
               are key factors in optimizing model generalization. Consequently, RF was selected as the preferred model for
               predicting the dynamic compressive strength of titanium alloys. The hyperparameter optimization ranges are
               shown in Table 6. The optimal configuration consists of a maximum depth of 15, a minimum of one sample
               per leaf, four samples required for node splitting, and 50 estimators, yielding a test R  of 0.88, representing
                                                                                        2
               the highest predictive accuracy achieved [Figure 9E].

               For predicting ductility, the twelve ML models were applied to the three-feature subset {Strain rate, B/G,
               Hmix} [Figure 10]. The RF model consistently achieved high predictive accuracy across both training and
               testing datasets. Hyperparameter optimization results are presented in Figure 11. Under the optimal
               configuration - a tree depth of 15, a minimum of one sample per leaf, a minimum of two samples required
               for node splitting, and 50 DTs - the model achieved an R  of 0.85 and an RMSE of 2.98% on the training
                                                                 2

