


Page 246 - Read Online
P. 246
Liu et al. J. Mater. Inf. 2026, 6, 18                                            Page 11 of 29


               Figure 2. The distribution of the strength dataset. The box plot distributions of flow strength, fracture strain and non-Ti alloying element
               characteristics in the datasets. (A-C) all show many outliers in terms of characteristics and target values; (D) The distribution of element
               quantities in titanium alloys indicates that most of the alloys in the dataset contain 4 to 6 elements.


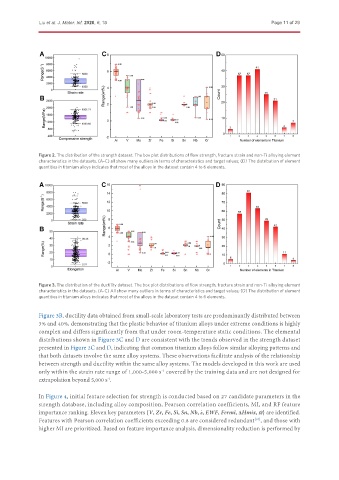
               Figure 3. The distribution of the ductility dataset. The box plot distributions of flow strength, fracture strain and non-Ti alloying element
               characteristics in the datasets. (A-C) All show many outliers in terms of characteristics and target values; (D) The distribution of element
               quantities in titanium alloys indicates that most of the alloys in the dataset contain 4 to 6 elements.


               Figure 3B, ductility data obtained from small-scale laboratory tests are predominantly distributed between
               3% and 40%, demonstrating that the plastic behavior of titanium alloys under extreme conditions is highly
               complex and differs significantly from that under room-temperature static conditions. The elemental
               distributions shown in Figure 3C and D are consistent with the trends observed in the strength dataset
               presented in Figure 2C and D, indicating that common titanium alloys follow similar alloying patterns and
               that both datasets involve the same alloy systems. These observations facilitate analysis of the relationship
               between strength and ductility within the same alloy systems. The models developed in this work are used
               only within the strain rate range of 1,000-5,000 s  covered by the training data and are not designed for
                                                          -1
               extrapolation beyond 5,000 s .
                                       -1

               In Figure 4, initial feature selection for strength is conducted based on 27 candidate parameters in the
               strength database, including alloy composition, Pearson correlation coefficients, MI, and RF feature
               importance ranking. Eleven key parameters {V, Zr, Fe, Si, Sn, Nb, ε, EWF, Fermi, ΔHmix, Ω} are identified.
                                                                       ¤
               Features with Pearson correlation coefficients exceeding 0.8 are considered redundant , and those with
                                                                                          [67]
               higher MI are prioritized. Based on feature importance analysis, dimensionality reduction is performed by

