


Page 245 - Read Online
P. 245
Page 10 of 29                                                      Liu et al. J. Mater. Inf. 2026, 6, 18


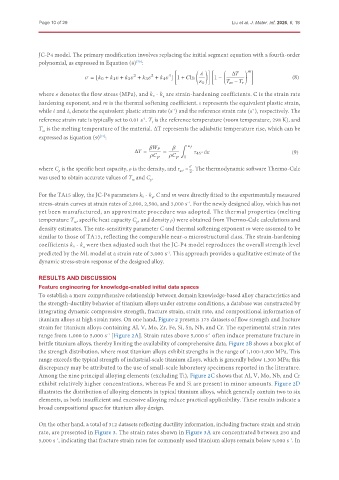
               JC-P4 model. The primary modification involves replacing the initial segment equation with a fourth-order
               polynomial, as expressed in Equation (8) :
                                                 [70]
                                                                         ¤              Δ

                                                            4
                                                2
                                                      3
                                  = [   0 +    1    +    2    +    3    +    4    ] 1 +   ln  1 −       (8)
                                                                          0            −
               where σ denotes the flow stress (MPa), and k 0 - k  are strain-hardening coefficients. C is the strain rate
                                                          4
               hardening exponent, and m is the thermal softening coefficient. ε represents the equivalent plastic strain,
               while ε and ε 0 denote the equivalent plastic strain rate (s ) and the reference strain rate (s ), respectively. The
                                                                                          -1
                                                              -1
                    ¤
                         ¤
               reference strain rate is typically set to 0.01 s . T  is the reference temperature (room temperature, 298 K), and
                                                   -1
                                                      r
               T  is the melting temperature of the material. ∆T represents the adiabatic temperature rise, which can be
                m
               expressed as Equation (9) :
                                    [71]
                                                                 ¹

                                                Δ   =     =             45° d                           (9)
                                                                        0
               where C  is the specific heat capacity, ρ is the density, and τ  =  . The thermodynamic software Thermo-Calc

                      p
                                                                45°
                                                                    2
               was used to obtain accurate values of T  and C .
                                                      p
                                               m
               For the TA15 alloy, the JC-P4 parameters k 0 - k , C and m were directly fitted to the experimentally measured
                                                      4
               stress–strain curves at strain rates of 2,000, 2,500, and 3,000 s . For the newly designed alloy, which has not
                                                                   -1
               yet been manufactured, an approximate procedure was adopted. The thermal properties (melting
               temperature T , specific heat capacity C , and density ρ) were obtained from Thermo-Calc calculations and
                           m
                                                 p
               density estimates. The rate-sensitivity parameter C and thermal softening exponent m were assumed to be
               similar to those of TA15, reflecting the comparable near-α microstructural class. The strain-hardening
               coefficients k 0 - k  were then adjusted such that the JC-P4 model reproduces the overall strength level
                              4
               predicted by the ML model at a strain rate of 3,000 s . This approach provides a qualitative estimate of the
                                                            -1
               dynamic stress-strain response of the designed alloy.
               RESULTS AND DISCUSSION
               Feature engineering for knowledge-enabled initial data spaces
               To establish a more comprehensive relationship between domain knowledge-based alloy characteristics and
               the strength-ductility behavior of titanium alloys under extreme conditions, a database was constructed by
               integrating dynamic compressive strength, fracture strain, strain rate, and compositional information of
               titanium alloys at high strain rates. On one hand, Figure 2 presents 175 datasets of flow strength and fracture
               strain for titanium alloys containing Al, V, Mo, Zr, Fe, Si, Sn, Nb, and Cr. The experimental strain rates
               range from 1,000 to 5,000 s  [Figure 2A]. Strain rates above 5,000 s  often induce premature fracture in
                                                                          -1
                                       -1
               brittle titanium alloys, thereby limiting the availability of comprehensive data. Figure 2B shows a box plot of
               the strength distribution, where most titanium alloys exhibit strengths in the range of 1,100-1,900 MPa. This
               range exceeds the typical strength of industrial-scale titanium alloys, which is generally below 1,300 MPa; this
               discrepancy may be attributed to the use of small-scale laboratory specimens reported in the literature.
               Among the nine principal alloying elements (excluding Ti), Figure 2C shows that Al, V, Mo, Nb, and Cr
               exhibit relatively higher concentrations, whereas Fe and Si are present in minor amounts. Figure 2D
               illustrates the distribution of alloying elements in typical titanium alloys, which generally contain two to six
               elements, as both insufficient and excessive alloying reduce practical applicability. These results indicate a
               broad compositional space for titanium alloy design.


               On the other hand, a total of 312 datasets reflecting ductility information, including fracture strain and strain
               rate, are presented in Figure 3. The strain rates shown in Figure 3A are concentrated between 250 and
               5,000 s , indicating that fracture strain rates for commonly used titanium alloys remain below 5,000 s . In
                                                                                                       -1
                     -1

