


Page 254 - Read Online
P. 254
Liu et al. J. Mater. Inf. 2026, 6, 18                                            Page 19 of 29


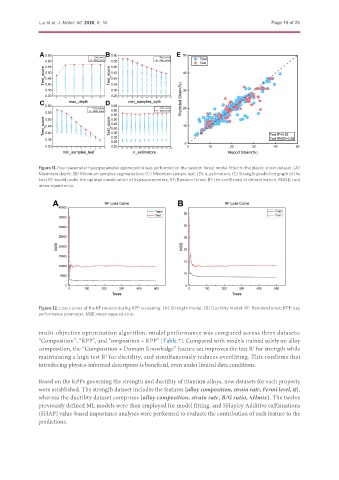
               Figure 11. Four-parameter hyperparameter optimization was performed on the random forest model fitted to the plastic strain dataset. (A)
               Maximum depth; (B) Minimum samples segmentation; (C) Minimum sample leaf; (D) n_estimators; (E) Strength prediction graph of the
               best RF model under the optimal combination of hyperparameters. RF: Random forest; R : the coefficient of determination; RMSE: root
                                                                           2
               mean square error.


               Figure 12. Loss curves of the RF models during KPP screening. (A) Strength model; (B) Ductility model. RF: Random forest; KPP: key
               performance parameter; MSE: mean squared error.


               multi-objective optimization algorithm, model performance was compared across three datasets:
               “Composition”, “KPP”, and “omposition + KPP” [Table 7]. Compared with models trained solely on alloy
               composition, the “Composition + Domain Knowledge” feature set improves the test R  for strength while
                                                                                          2
               maintaining a high test R  for ductility, and simultaneously reduces overfitting. This confirms that
                                      2
               introducing physics-informed descriptors is beneficial, even under limited data conditions.

               Based on the KPPs governing the strength and ductility of titanium alloys, new datasets for each property
               were established. The strength dataset includes the features {alloy composition, strain rate, Fermi level, Ω},
               whereas the ductility dataset comprises {alloy composition, strain rate, B/G ratio, ΔHmix}. The twelve
               previously defined ML models were then employed for model fitting, and SHapley Additive exPlanations
               (SHAP) value-based importance analyses were performed to evaluate the contribution of each feature to the
               predictions.

