


Page 259 - Read Online
P. 259
Page 24 of 29                                                      Liu et al. J. Mater. Inf. 2026, 6, 18


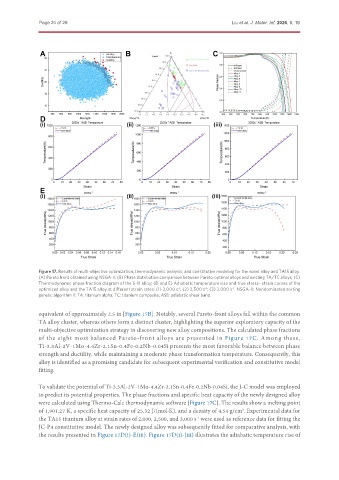
               Figure 17. Results of multi-objective optimization, thermodynamic analysis, and constitutive modeling for the novel alloy and TA15 alloy.
               (A) Pareto front obtained using NSGA-II; (B) Phase distribution comparison between Pareto-optimal alloys and existing TA/TC alloys; (C)
               Thermodynamic phase fraction diagram of the 5-11 alloy; (D and E) Adiabatic temperature rise and true stress- strain curves of the
               optimized alloy and the TA15 alloy at different strain rates: (1) 2,000 s ; (2) 2,500 s ; (3) 3,000 s . NSGA-II: Nondominated sorting
                                                                -1
                                                                         -1
                                                                                   -1
               genetic algorithm II; TA: titanium alpha; TC: titanium composite; ASB: adiabatic shear band.
               equivalent of approximately 2.5 in [Figure 17B]. Notably, several Pareto-front alloys fall within the common
               TA alloy cluster, whereas others form a distinct cluster, highlighting the superior exploratory capacity of the
               multi-objective optimization strategy in discovering new alloy compositions. The calculated phase fractions
               of the eight most balanced Pareto-front alloys are presented in Figure 17C. Among these,
               Ti-3.3Al-2V-1Mo-4.4Zr-2.1Sn-0.4Fe-0.2Nb-0.04Si presents the most favorable balance between phase
               strength and ductility, while maintaining a moderate phase transformation temperature. Consequently, this
               alloy is identified as a promising candidate for subsequent experimental verification and constitutive model
               fitting.


               To validate the potential of Ti-3.3Al-2V-1Mo-4.4Zr-2.1Sn-0.4Fe-0.2Nb-0.04Si, the J–C model was employed
               to predict its potential properties. The phase fractions and specific heat capacity of the newly designed alloy
               were calculated using Thermo-Calc thermodynamic software [Figure 17C]. The results show a melting point
               of 1,901.27 K, a specific heat capacity of 25.32 J/(mol·K), and a density of 4.54 g/cm . Experimental data for
                                                                                      3
               the TA15 titanium alloy at strain rates of 2,000, 2,500, and 3,000 s  were used as reference data for fitting the
                                                                      -1
               JC-P4 constitutive model. The newly designed alloy was subsequently fitted for comparative analysis, with
               the results presented in Figure 17D(i)-E(iii). Figure 17D(i)-(iii) illustrates the adiabatic temperature rise of

