


Page 162 - Read Online
P. 162
Page 6 of 19                                                     Wang et al. J. Mater. Inf. 2026, 6, 13


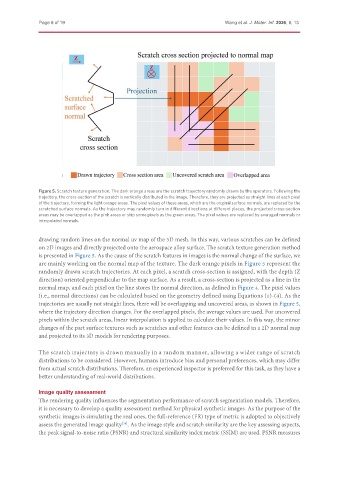
               Figure 5. Scratch texture generation. The dark orange areas are the scratch trajectory randomly drawn by the operators. Following the
               trajectory, the cross-section of the scratch is vertically distributed in the image. Therefore, they are projected as straight lines at each pixel
               of the trajectory, forming the light orange areas. The pixel values of these areas, which are the original surface normals, are replaced by the
               scratched surface normals. As the trajectory may randomly turn in different directions at different places, the projected cross-section
               areas may be overlapped as the pink areas or skip some pixels as the green areas. The pixel values are replaced by averaged normals or
               interpolated normals.

               drawing random lines on the normal uv map of the 3D mesh. In this way, various scratches can be defined
               on 2D images and directly projected onto the aerospace alloy surface. The scratch texture generation method
               is presented in Figure 5. As the cause of the scratch features in images is the normal change of the surface, we
               are mainly working on the normal map of the texture. The dark orange pixels in Figure 5 represent the
               randomly drawn scratch trajectories. At each pixel, a scratch cross-section is assigned, with the depth (Z
               direction) oriented perpendicular to the map surface. As a result, a cross-section is projected as a line in the
               normal map, and each pixel on the line stores the normal direction, as defined in Figure 4. The pixel values
               (i.e., normal directions) can be calculated based on the geometry defined using Equations (1)-(4). As the
               trajectories are usually not straight lines, there will be overlapping and uncovered areas, as shown in Figure 5,
               where the trajectory direction changes. For the overlapped pixels, the average values are used. For uncovered
               pixels within the scratch areas, linear interpolation is applied to calculate their values. In this way, the minor
               changes of the part surface textures such as scratches and other features can be defined in a 2D normal map
               and projected to its 3D models for rendering purposes.


               The scratch trajectory is drawn manually in a random manner, allowing a wider range of scratch
               distributions to be considered. However, humans introduce bias and personal preferences, which may differ
               from actual scratch distributions. Therefore, an experienced inspector is preferred for this task, as they have a
               better understanding of real-world distributions.


               Image quality assessment
               The rendering quality influences the segmentation performance of scratch segmentation models. Therefore,
               it is necessary to develop a quality assessment method for physical synthetic images. As the purpose of the
               synthetic images is simulating the real ones, the full-reference (FR) type of metric is adopted to objectively
               assess the generated image quality . As the image style and scratch similarity are the key assessing aspects,
                                            [34]
               the peak signal-to-noise ratio (PSNR) and structural similarity index metric (SSIM) are used. PSNR measures

