


Page 166 - Read Online
P. 166
Page 10 of 19                                                    Wang et al. J. Mater. Inf. 2026, 6, 13


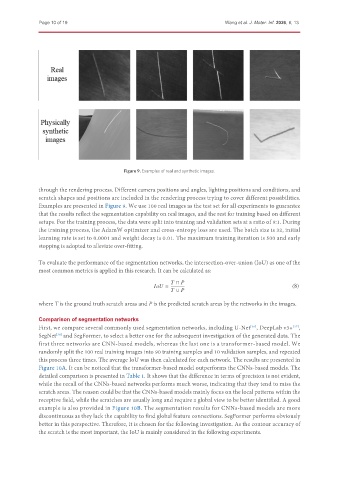
                                             Figure 9. Examples of real and synthetic images.

               through the rendering process. Different camera positions and angles, lighting positions and conditions, and
               scratch shapes and positions are included in the rendering process trying to cover different possibilities.
               Examples are presented in Figure 9. We use 100 real images as the test set for all experiments to guarantee
               that the results reflect the segmentation capability on real images, and the rest for training based on different
               setups. For the training process, the data were split into training and validation sets at a ratio of 9:1. During
               the training process, the AdamW optimizer and cross-entropy loss are used. The batch size is 32, initial
               learning rate is set to 0.0001 and weight decay is 0.01. The maximum training iteration is 500 and early
               stopping is adopted to alleviate over-fitting.

               To evaluate the performance of the segmentation networks, the intersection-over-union (IoU) as one of the
               most common metrics is applied in this research. It can be calculated as:

                                                                ∩
                                                              =                                         (8)
                                                                ∪

               where T is the ground truth scratch areas and P is the predicted scratch areas by the networks in the images.

               Comparison of segmentation networks
               First, we compare several commonly used segmentation networks, including U-Net , DeepLab v3+ ,
                                                                                                        [37]
                                                                                         [36]
               SegNet  and SegFormer, to select a better one for the subsequent investigation of the generated data. The
                     [38]
               first three networks are CNN-based models, whereas the last one is a transformer-based model. We
               randomly split the 100 real training images into 90 training samples and 10 validation samples, and repeated
               this process three times. The average IoU was then calculated for each network. The results are presented in
               Figure 10A. It can be noticed that the transformer-based model outperforms the CNNs-based models. The
               detailed comparison is presented in Table 1. It shows that the difference in terms of precision is not evident,
               while the recall of the CNNs-based networks performs much worse, indicating that they tend to miss the
               scratch areas. The reason could be that the CNNs-based models mainly focus on the local patterns within the
               receptive field, while the scratches are usually long and require a global view to be better identified. A good
               example is also provided in Figure 10B. The segmentation results for CNNs-based models are more
               discontinuous as they lack the capability to find global feature connections. SegFormer performs obviously
               better in this perspective. Therefore, it is chosen for the following investigation. As the contour accuracy of
               the scratch is the most important, the IoU is mainly considered in the following experiments.

