


Page 163 - Read Online
P. 163
Wang et al. J. Mater. Inf. 2026, 6, 13                                            Page 7 of 19


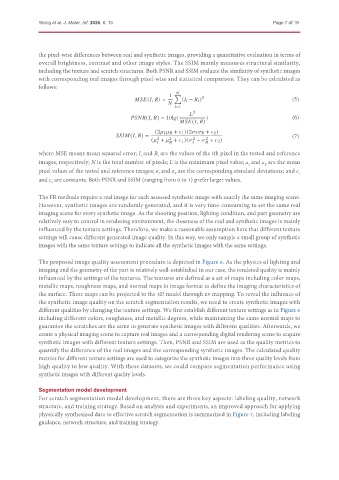
               the pixel-wise differences between real and synthetic images, providing a quantitative evaluation in terms of
               overall brightness, contrast and other image styles. The SSIM mainly measures structural similarity,
               including the texture and scratch structures. Both PSNR and SSIM evaluate the similarity of synthetic images
               with corresponding real images through pixel-wise and statistical comparison. They can be calculated as
               follows:
                                                            1     ∑     2
                                                      (  ,   ) =  (      −       )                      (5)

                                                                =1
                                                                       2
                                                       (  ,   ) = 10lg(  )                              (6)
                                                                      (  ,   )
                                                        (2            +    1 )(2            +    2 )
                                                  (  ,   ) =  2  2   2   2                              (7)
                                                      (   +    +    1 )(   +    +    2 )

               where MSE means mean squared error; I and R are the values of the ith pixel in the tested and reference
                                                  i
                                                        i
               images, respectively; N is the total number of pixels; L is the maximum pixel value; μ  and μ  are the mean
                                                                                        I
                                                                                              R
               pixel values of the tested and reference images; σ  and σ  are the corresponding standard deviations; and c 1
                                                         I
                                                              R
               and c  are constants. Both PSNR and SSIM (ranging from 0 to 1) prefer larger values.
                   2
               The FR methods require a real image for each assessed synthetic image with exactly the same imaging scene.
               However, synthetic images are randomly generated, and it is very time-consuming to set the same real
               imaging scene for every synthetic image. As the shooting position, lighting condition, and part geometry are
               relatively easy to control in rendering environment, the closeness of the real and synthetic images is mainly
               influenced by the texture settings. Therefore, we make a reasonable assumption here that different texture
               settings will cause different generated image quality. In this way, we only sample a small group of synthetic
               images with the same texture settings to indicate all the synthetic images with the same settings.

               The proposed image quality assessment procedure is depicted in Figure 6. As the physics of lighting and
               imaging and the geometry of the part is relatively well-established in our case, the rendered quality is mainly
               influenced by the settings of the textures. The textures are defined as a set of maps including color maps,
               metallic maps, roughness maps, and normal maps in image format to define the imaging characteristics of
               the surface. These maps can be projected to the 3D model through uv mapping. To reveal the influence of
               the synthetic image quality on the scratch segmentation results, we need to create synthetic images with
               different qualities by changing the texture settings. We first establish different texture settings as in Figure 6
               including different colors, roughness, and metallic degrees, while maintaining the same normal maps to
               guarantee the scratches are the same to generate synthetic images with different qualities. Afterwards, we
               create a physical imaging scene to capture real images and a corresponding digital rendering scene to acquire
               synthetic images with different texture settings. Then, PSNR and SSIM are used as the quality metrics to
               quantify the difference of the real images and the corresponding synthetic images. The calculated quality
               metrics for different texture settings are used to categorize the synthetic images into three quality levels from
               high quality to low quality. With these datasets, we could compare segmentation performance using
               synthetic images with different quality levels.


               Segmentation model development
               For scratch segmentation model development, there are three key aspects: labeling quality, network
               structure, and training strategy. Based on analysis and experiments, an improved approach for applying
               physically synthesized data to effective scratch segmentation is summarized in Figure 7, including labeling
               guidance, network structure, and training strategy.

