


Page 167 - Read Online
P. 167
Wang et al. J. Mater. Inf. 2026, 6, 13                                           Page 11 of 19


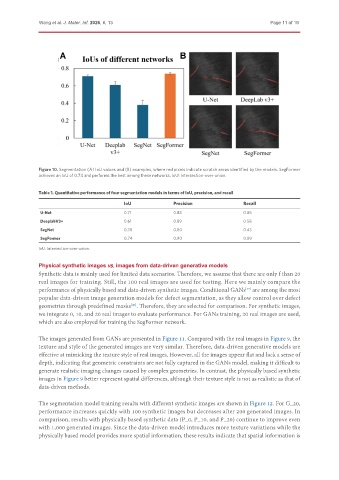
               Figure 10. Segmentation (A) IoU values and (B) examples, where red pixels indicate scratch areas identified by the models. SegFormer
               achieves an IoU of 0.74 and performs the best among these networks. IoU: Intersection-over-union.


               Table 1. Quantitative performance of four segmentation models in terms of IoU, precision, and recall
                                             IoU              Precision               Recall
               U-Net                         0.71             0.83                    0.85
               DeeplabV3+                    0.61             0.89                    0.58
               SegNet                        0.38             0.80                    0.43
               SegFormer                     0.74             0.90                    0.89
               IoU: Intersection-over-union.


               Physical synthetic images vs. images from data-driven generative models
               Synthetic data is mainly used for limited data scenarios. Therefore, we assume that there are only f than 20
               real images for training. Still, the 100 real images are used for testing. Here we mainly compare the
               performance of physically based and data-driven synthetic images. Conditional GANs  are among the most
                                                                                       [39]
               popular data-driven image generation models for defect segmentation, as they allow control over defect
               geometries through predefined masks . Therefore, they are selected for comparison. For synthetic images,
                                               [40]
               we integrate 0, 10, and 20 real images to evaluate performance. For GANs training, 20 real images are used,
               which are also employed for training the SegFormer network.

               The images generated from GANs are presented in Figure 11. Compared with the real images in Figure 9, the
               texture and style of the generated images are very similar. Therefore, data-driven generative models are
               effective at mimicking the texture style of real images. However, all the images appear flat and lack a sense of
               depth, indicating that geometric constraints are not fully captured in the GANs model, making it difficult to
               generate realistic imaging changes caused by complex geometries. In contrast, the physically based synthetic
               images in Figure 9 better represent spatial differences, although their texture style is not as realistic as that of
               data-driven methods.

               The segmentation model training results with different synthetic images are shown in Figure 12. For G_20,
               performance increases quickly with 100 synthetic images but decreases after 200 generated images. In
               comparison, results with physically based synthetic data (P_0, P_10, and P_20) continue to improve even
               with 1,000 generated images. Since the data-driven model introduces more texture variations while the
               physically based model provides more spatial information, these results indicate that spatial information is

