
Page 103 - Read Online
P. 103
Amatori et al. RT-qPCR array for gene expression
amplification curves generated during real-time Total RNA was extracted from treated and untreated
amplification [Figure 4B and C], while specificity was HeLa cells and its integrity evaluated by monitoring
confirmed by analyzing the uniqueness of the PCR 28S to 18S rRNA ratio through AGE (data not
product by melting curve peaks analysis [Figure 4D and E] shown). After fluorometric quantitation, 1 µg of RNA
and AGE (data not shown). was retro-transcribed and the resulting cDNA used
for qPCR analysis.
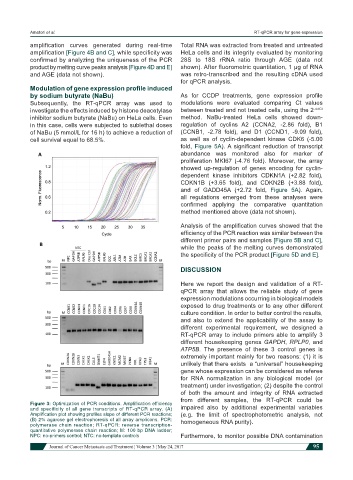
Modulation of gene expression profile induced
by sodium butyrate (NaBu) As for CCDP treatments, gene expression profile
Subsequently, the RT-qPCR array was used to modulations were evaluated comparing Ct values
investigate the effects induced by histone deacetylase between treated and not treated cells, using the 2 -∆∆Ct
inhibitor sodium butyrate (NaBu) on HeLa cells. Even method. NaBu-treated HeLa cells showed down-
in this case, cells were subjected to sublethal doses regulation of cyclins A2 (CCNA2, -2.86 fold), B1
of NaBu (5 mmol/L for 16 h) to achieve a reduction of (CCNB1, -2.78 fold), and D1 (CCND1, -9.09 fold),
cell survival equal to 68.5%. as well as of cyclin-dependent kinase CDK6 (-5.00
fold, Figure 5A). A significant reduction of transcript
abundance was monitored also for marker of
proliferation MKI67 (-4.76 fold). Moreover, the array
showed up-regulation of genes encoding for cyclin-
dependent kinase inhibitors CDKN1A (+2.82 fold),
CDKN1B (+3.65 fold), and CDKN2B (+3.88 fold),
and of GADD45A (+2.72 fold, Figure 5A). Again,
all regulations emerged from these analyses were
confirmed applying the comparative quantitation
method mentioned above (data not shown).
Analysis of the amplification curves showed that the
efficiency of the PCR reaction was similar between the
different primer pairs and samples [Figure 5B and C],
while the peaks of the melting curves demonstrated
the specificity of the PCR product [Figure 5D and E].
DISCUSSION
Here we report the design and validation of a RT-
qPCR array that allows the reliable study of gene
expression modulations occurring in biological models
exposed to drug treatments or to any other different
culture condition. In order to better control the results,
and also to extend the applicability of the assay to
different experimental requirement, we designed a
RT-qPCR array to include primers able to amplify 3
different housekeeping genes GAPDH, RPLP0, and
ATP5B. The presence of these 3 control genes is
extremely important mainly for two reasons: (1) it is
unlikely that there exists a “universal” housekeeping
gene whose expression can be considered as referee
for RNA normalization in any biological model (or
treatment) under investigation; (2) despite the control
of both the amount and integrity of RNA extracted
from different samples, the RT-qPCR could be
Figure 3: Optimization of PCR conditions. Amplification efficiency
and specificity of all gene transcripts of RT-qPCR array. (A) impaired also by additional experimental variables
Amplification plot showing profiles slope of different PCR reactions; (e.g. the limit of spectrophotometric analysis, not
(B) 2% agarose gel electrophoresis of all array amplicons. PCR: homogeneous RNA purity).
polymerase chain reaction; RT-qPCR: reverse transcription-
quantitative polymerase chain reaction; M: 100 bp DNA ladder;
NPC: no-primers control; NTC: no-template controls Furthermore, to monitor possible DNA contamination
Journal of Cancer Metastasis and Treatment ¦ Volume 3 ¦ May 24, 2017 95