
Page 101 - Read Online
P. 101
Amatori et al. RT-qPCR array for gene expression
Table 2: Parameters employed for primers design procedure (purple disc section, Figure 1). The same
Min Tm (°C) 58 GAPDH-primer pair was used to amplify commercial
Max Tm (°C) 62 genomic DNA as both positive PCR reaction control
Primer Tm requirements Optimal Tm (°C) 60
Max Tm Difference (°C) 2 and internal standard control to compare the efficiency
Primer GC content Min GC (%) 40 of amplifications performed at different times in different
requirements Max GC (%) 60 discs (orange disc section, Figure 1).
Min length (bp) 12
Primer length Max length (bp) 40 In order to better control the results, and also to
requirements Optimal length (bp) 20 extend the applicability of the assay to different
Min length (bp) 150
Amplicon requirements experimental conditions, we designed the RT-qPCR
Max length (bp) 250 array, including primer pairs able to amplify the 3
Tm: melting temperature
stable and housekeeping gene transcripts GAPDH,
forward and reverse primer, 1x SYBR Green mastermix RPLP0 and ATP5B, to be used as reference for gene
(as indicated in Results section) and 0.2 µL of cDNA expression normalization. All reactions were placed
solution, as described. The following thermal profile in the 100-well disc in duplicate (red disc section,
[14]
was applied: 1 cycle at 95 °C for 10 min, 40 cycles Figure 1).
at 95 °C for 10 s, 64 °C for 30 s, and 72 °C for 15 s.
Melting curve analysis was performed ramping from Primers were designed following parameters reported
60 °C to 90 °C and rising by 0.5 °C every 2 s. in Table 2 in order to optimize and make uniform
all PCR reactions of the array. To achieve the best
Gene expression variations were evaluated in term results, we chose primer pairs with the lowest penalty
of fold induction respect to the untreated cellular value given by the PrimerExpress 2.0 software.
population (control) by both the 2 -∆∆CT method and
‘Comparative Quantitation’ tool of the Rotor Gene 6000 PCR conditions optimization
Series software 1.7. Expression stability values of In order to optimize the PCR experimental condition,
the different housekeeping genes were calculated by we evaluated: (1) primer efficiency by analyzing
Norm Finder software to choose the best reference the slope of the real-time amplification curves; (2)
[15]
gene for normalization. Filtering of results was carried absence of primer-dimer amplification; (3) specificity
out as follows: genes were considered differently of the product; (4) absence of unspecific products
expressed when their change was greater than ± by both agarose gel electrophoresis (AGE), and
2.5 fold respect to the transcript levels of untreated analysis of the melting curve profiles generated after
sample, as already described. All experiments were PCR amplification. First, we compared 4 different
[16]
conducted in triplicate. commercially available master mixes and selected the
1 that, in our conditions, gave the best results in terms
RESULTS
RT-qPCR array design
The RT-qPCR array was developed to study modulation
of transcript abundance of 41 human genes involved
in regulation of key cellular pathways, such as cell
cycle, DNA damage, cellular proliferation, apoptosis,
and senescence [Table 1]. The RT-qPCR array was
designed exploiting 100-well discs compatible with
the Rotor-Gene 6000 instrument [Figure 1], but it
could be easily adapted to standard 96-well plates.
Most importantly, our array was designed to harbor
several technical controls to statistically evaluate
final results and to exclude possible experimental
bias. Six wells were reserved for no template controls
(NTC) to monitor possible contamination (amplifying
3 housekeeping genes GAPDH, RPLP0, and ATP5B-
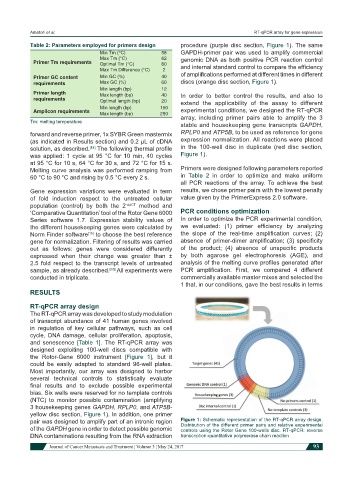
yellow disc section, Figure 1). In addition, one primer
pair was designed to amplify part of an intronic region Figure 1: Schematic representation of the RT-qPCR array design.
Distribution of the different primer pairs and relative experimental
of the GAPDH gene in order to detect possible genomic controls using the Rotor Gene 100-wells disc. RT-qPCR: reverse
DNA contaminations resulting from the RNA extraction transcription-quantitative polymerase chain reaction
Journal of Cancer Metastasis and Treatment ¦ Volume 3 ¦ May 24, 2017 93