
Page 112 - Read Online
P. 112
Songthumjitti et al. Intell Robot 2023;3(3):306-36 I http://dx.doi.org/10.20517/ir.2023.20 Page 9 of 31
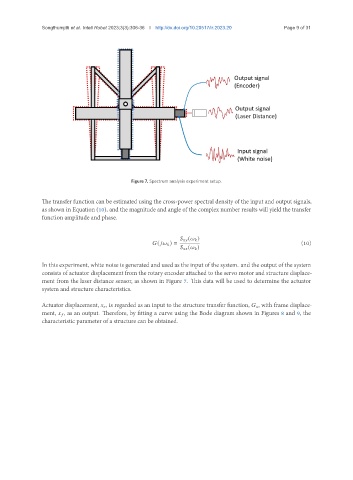
Figure 7. Spectrum analysis experiment setup.
The transfer function can be estimated using the cross-power spectral density of the input and output signals,
as shown in Equation (10), and the magnitude and angle of the complex number results will yield the transfer
function amplitude and phase.
( )
( ) = (10)
( )
In this experiment, white noise is generated and used as the input of the system. and the output of the system
consists of actuator displacement from the rotary encoder attached to the servo motor and structure displace-
ment from the laser distance sensor, as shown in Figure 7. This data will be used to determine the actuator
system and structure characteristics.
Actuator displacement, , is regarded as an input to the structure transfer function, , with frame displace-
ment, , as an output. Therefore, by fitting a curve using the Bode diagram shown in Figures 8 and 9, the
characteristic parameter of a structure can be obtained.