
Page 113 - Read Online
P. 113
Page 10 of 31 Songthumjitti et al. Intell Robot 2023;3(3):306-36 I http://dx.doi.org/10.20517/ir.2023.20
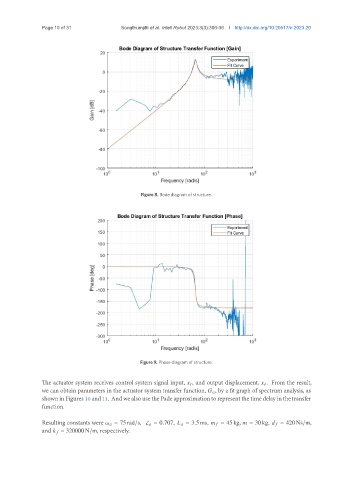
Figure 8. Bode diagram of structure.
Figure 9. Phase diagram of structure.
The actuator system receives control system signal input, , and output displacement, . From the result,
we can obtain parameters in the actuator system transfer function, , by a fit graph of spectrum analysis, as
shownin Figures 10 and 11. And wealso use the Pade approximation to representthe time delay in the transfer
function.
Resulting constants were = 75 rad/s, = 0.707, = 3.5 ms, = 45 kg, = 30 kg, = 420 Ns/m,
and = 320000 N/m, respectively.