
Page 111 - Read Online
P. 111
Page 8 of 31 Songthumjitti et al. Intell Robot 2023;3(3):306-36 I http://dx.doi.org/10.20517/ir.2023.20
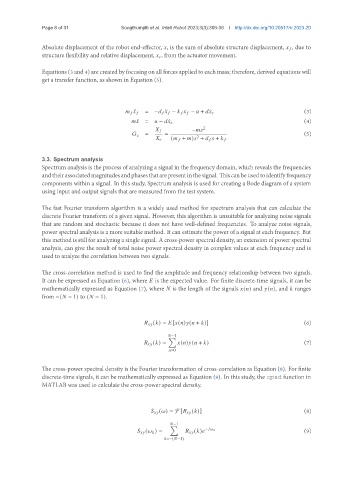
Absolute displacement of the robot end-effector, , is the sum of absolute structure displacement, , due to
structure flexibility and relative displacement, , from the actuator movement.
Equations (3 and 4) are created by focusing on all forces applied to each mass; therefore, derived equations will
get a transfer function, as shown in Equation (5).
¥ = − ¥ − − + ¤ (3)
¥ = − ¤ (4)
− 2
= = (5)
2
( + ) + +
3.3. Spectrum analysis
Spectrum analysis is the process of analyzing a signal in the frequency domain, which reveals the frequencies
andtheirassociatedmagnitudesandphasesthatarepresentinthesignal. Thiscanbeusedtoidentifyfrequency
components within a signal. In this study, Spectrum analysis is used for creating a Bode diagram of a system
using input and output signals that are measured from the test system.
The fast Fourier transform algorithm is a widely used method for spectrum analysis that can calculate the
discrete Fourier transform of a given signal. However, this algorithm is unsuitable for analyzing noise signals
that are random and stochastic because it does not have well-defined frequencies. To analyze noise signals,
power spectral analysis is a more suitable method. It can estimate the power of a signal at each frequency. But
this method is still for analyzing a single signal. A cross-power spectral density, an extension of power spectral
analysis, can give the result of total noise power spectral density in complex values at each frequency and is
used to analyze the correlation between two signals.
The cross-correlation method is used to find the amplitude and frequency relationship between two signals.
It can be expressed as Equation (6), where is the expected value. For finite discrete-time signals, it can be
mathematically expressed as Equation (7), where is the length of the signals ( ) and ( ), and ranges
from −( − 1) to ( − 1).
(6)
( ) = [ ( ) ( + )]
−1
∑
( ) = ( ) ( + ) (7)
=0
The cross-power spectral density is the Fourier transformation of cross-correlation as Equation (8). For finite
discrete-time signals, it can be mathematically expressed as Equation (9). In this study, the cpsd function in
MATLAB was used to calculate the cross-power spectral density.
( ) = F [ ( )] (8)
−1
∑
( ) = ( ) − (9)
=−( −1)