
Page 115 - Read Online
P. 115
Page 12 of 31 Songthumjitti et al. Intell Robot 2023;3(3):306-36 I http://dx.doi.org/10.20517/ir.2023.20
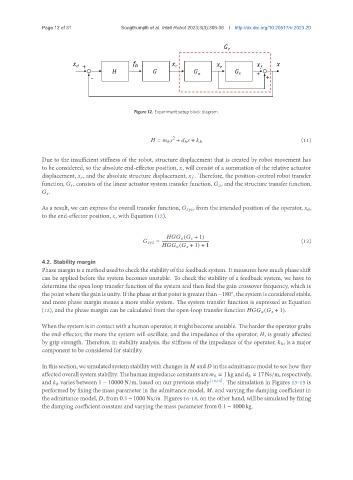
Figure 12. Experiment setup block diagram.
2 (11)
= ℎ + ℎ + ℎ
Due to the insufficient stiffness of the robot, structure displacement that is created by robot movement has
to be considered, so the absolute end-effector position, , will consist of a summation of the relative actuator
displacement, , and the absolute structure displacement, . Therefore, the position-control robot transfer
function, , consists of the linear actuator system transfer function, , and the structure transfer function,
.
As a result, we can express the overall transfer function, , from the intended position of the operator, ,
to the end-effector position, , with Equation (12).
( + 1)
= (12)
( + 1) + 1
4.2. Stability margin
Phase margin is a method used to check the stability of the feedback system. It measures how much phase shift
can be applied before the system becomes unstable. To check the stability of a feedback system, we have to
determine the open loop transfer function of the system and then find the gain crossover frequency, which is
thepointwherethegainisunity. Ifthephaseatthatpointisgreaterthan −180 , thesystemisconsideredstable,
◦
and more phase margin means a more stable system. The system transfer function is expressed as Equation
(12), and the phase margin can be calculated from the open-loop transfer function ( + 1).
When the system is in contact with a human operator, it might become unstable. The harder the operator grabs
the end-effector, the more the system will oscillate, and the impedance of the operator, , is greatly affected
by grip strength. Therefore, in stability analysis, the stiffness of the impedance of the operator, ℎ, is a major
component to be considered for stability.
Inthissection, wesimulatedsystemstabilitywithchangesin and intheadmittancemodeltoseehowthey
affectedoverallsystemstability. Thehumanimpedanceconstantsare ℎ = 1 kgand ℎ = 17 Ns/m,respectively,
and ℎ varies between 1 − 10000 N/m, based on our previous study [18,19] . The simulation in Figures 13-15 is
performed by fixing the mass parameter in the admittance model, , and varying the damping coefficient in
the admittance model, , from 0.1 − 1000 Ns/m. Figures 16-18, on the other hand, will be simulated by fixing
the damping coefficient constant and varying the mass parameter from 0.1 − 1000 kg.