
Page 120 - Read Online
P. 120
Songthumjitti et al. Intell Robot 2023;3(3):306-36 I http://dx.doi.org/10.20517/ir.2023.20 Page 17 of 31
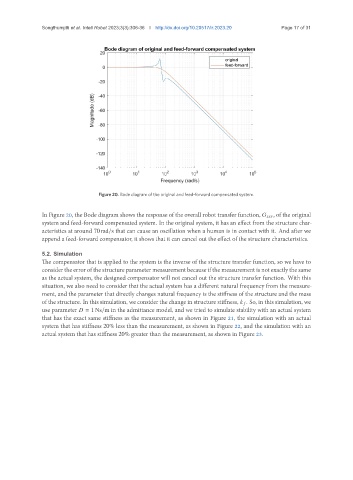
Figure 20. Bode diagram of the original and feed-forward compensated system.
In Figure 20, the Bode diagram shows the response of the overall robot transfer function, , of the original
system and feed-forward compensated system. In the original system, it has an effect from the structure char-
acteristics at around 70 rad/s that can cause an oscillation when a human is in contact with it. And after we
append a feed-forward compensator, it shows that it can cancel out the effect of the structure characteristics.
5.2. Simulation
The compensator that is applied to the system is the inverse of the structure transfer function, so we have to
consider the error of the structure parameter measurement because if the measurement is not exactly the same
as the actual system, the designed compensator will not cancel out the structure transfer function. With this
situation, we also need to consider that the actual system has a different natural frequency from the measure-
ment, and the parameter that directly changes natural frequency is the stiffness of the structure and the mass
of the structure. In this simulation, we consider the change in structure stiffness, . So, in this simulation, we
use parameter = 1 Ns/m in the admittance model, and we tried to simulate stability with an actual system
that has the exact same stiffness as the measurement, as shown in Figure 21, the simulation with an actual
system that has stiffness 20% less than the measurement, as shown in Figure 22, and the simulation with an
actual system that has stiffness 20% greater than the measurement, as shown in Figure 23.