
Page 17 - Read Online
P. 17
Eitan et al. Extracell Vesicles Circ Nucleic Acids 2023;4:133-150 https://dx.doi.org/10.20517/evcna.2023.13 Page 141
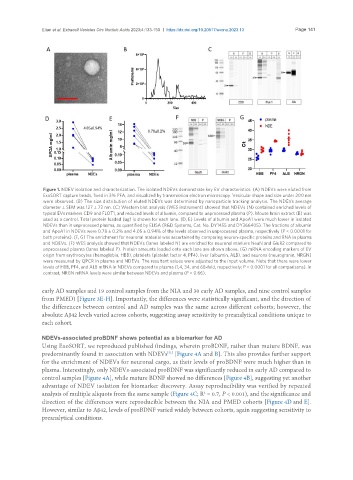
Figure 1. NDEV isolation and characterization. The isolated NDEVs demonstrate key EV characteristics. (A) NDEVs were eluted from
ExoSORT capture beads, fixed in 3% PFA, and visualized by transmission electron microscopy. Vesicular shape and size under 200 nm
were observed. (B) The size distribution of eluted NDEVs was determined by nanoparticle tracking analysis. The NDEVs average
diameter ± SEM was 127 ± 72 nm. (C) Western blot analysis (WES instrument) showed that NDEVs (N) contained enriched levels of
typical EVs markers CD9 and FLOT1, and reduced levels of albumin, compared to unprocessed plasma (P). Mouse brain extract (B) was
used as a control. Total protein loaded (ug) is shown for each lane. (D, E) Levels of albumin and ApoA1 were much lower in isolated
NDEVs than in unprocessed plasma, as quantified by ELISA (R&D Systems, Cat. No. DY1455 and DY366405). The fractions of albumin
and ApoA1 in NDEVs were 0.78 ± 0.2% and 4.05 ± 0.94% of the levels observed in unprocessed plasma, respectively (P < 0.0001 for
both proteins). (F, G) The enrichment for neuronal material was ascertained by comparing neuron-specific proteins and RNA in plasma
and NDEVs. (F) WES analysis showed that NDEVs (lanes labeled N) are enriched for neuronal markers NeuN and GluR2 compared to
unprocessed plasma (lanes labeled P). Protein amounts loaded onto each lane are shown above. (G) mRNA encoding markers of EV
origin from erythrocytes (hemoglobin, HBB), platelets (platelet factor 4, PF4), liver (albumin, ALB), and neurons (neurogranin, NRGN)
were measured by QPCR in plasma and NDEVs. The resultant values were adjusted to the input volume. Note that there were lower
levels of HBB, PF4, and ALB mRNA in NDEVs compared to plasma (1,4, 34, and 68-fold, respectively; P < 0.0001 for all comparisons). In
contrast, NRGN mRNA levels were similar between NDEVs and plasma (P = 0.66).
early AD samples and 19 control samples from the NIA and 30 early AD samples, and nine control samples
from PMED) [Figure 3E-H]. Importantly, the differences were statistically significant, and the direction of
the differences between control and AD samples was the same across different cohorts; however, the
absolute Aβ42 levels varied across cohorts, suggesting assay sensitivity to preanalytical conditions unique to
each cohort.
NDEVs-associated proBDNF shows potential as a biomarker for AD
Using ExoSORT, we reproduced published findings, wherein proBDNF, rather than mature BDNF, was
predominantly found in association with NDEVs [Figure 4A and B]. This also provides further support
[31]
for the enrichment of NDEVs for neuronal cargo, as their levels of proBDNF were much higher than in
plasma. Interestingly, only NDEVs-associated proBDNF was significantly reduced in early AD compared to
control samples [Figure 4A], while mature BDNF showed no differences [Figure 4B], suggesting yet another
advantage of NDEV isolation for biomarker discovery. Assay reproducibility was verified by repeated
analysis of multiple aliquots from the same sample (Figure 4C; R = 0.7, P < 0.001), and the significance and
2
direction of the differences were reproducible between the NIA and PMED cohorts [Figure 4D and E].
However, similar to Aβ42, levels of proBDNF varied widely between cohorts, again suggesting sensitivity to
preanalytical conditions.