
Page 13 - Read Online
P. 13
Eitan et al. Extracell Vesicles Circ Nucleic Acids 2023;4:133-150 https://dx.doi.org/10.20517/evcna.2023.13 Page 137
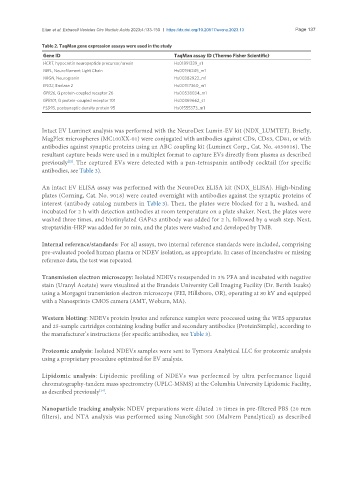
Table 2. TaqMan gene expression assays were used in the study
Gene ID TaqMan assay ID (Thermo Fisher Scientific)
HCRT, hypocretin neuropeptide precursor/orexin Hs01891339_s1
NEFL, Neurofilament Light Chain Hs00196245_m1
NRGN, Neurogranin Hs00382922_m1
ENO2, Enolase 2 Hs00157360_m1
GPR26, G protein-coupled receptor 26 Hs00538034_m1
GPR101, G protein-coupled receptor 101 Hs00369662_s1
PSD95, postsynaptic density protein 95 Hs01555373_m1
Intact EV Luminex analysis was performed with the NeuroDex Lumin-EV kit (NDX_LUMTET). Briefly,
MagPlex microspheres (MC100XX-01) were conjugated with antibodies against CD9, CD63, CD81, or with
antibodies against synaptic proteins using an ABC coupling kit (Luminex Corp., Cat. No. 4050016). The
resultant capture beads were used in a multiplex format to capture EVs directly from plasma as described
previously . The captured EVs were detected with a pan-tetraspanin antibody cocktail (for specific
[22]
antibodies, see Table 3).
An intact EV ELISA assay was performed with the NeuroDex ELISA kit (NDX_ELISA). High-binding
plates (Corning, Cat. No. 9018) were coated overnight with antibodies against the synaptic proteins of
interest (antibody catalog numbers in Table 3). Then, the plates were blocked for 2 h, washed, and
incubated for 2 h with detection antibodies at room temperature on a plate shaker. Next, the plates were
washed three times, and biotinylated GAP43 antibody was added for 2 h, followed by a wash step. Next,
streptavidin-HRP was added for 30 min, and the plates were washed and developed by TMB.
Internal reference/standards: For all assays, two internal reference standards were included, comprising
pre-evaluated pooled human plasma or NDEV isolation, as appropriate. In cases of inconclusive or missing
reference data, the test was repeated.
Transmission electron microscopy: Isolated NDEVs resuspended in 3% PFA and incubated with negative
stain (Uranyl Acetate) were visualized at the Brandeis University Cell Imaging Facility (Dr. Berith Isaaks)
using a Morgagni transmission electron microscope (FEI, Hillsboro, OR), operating at 80 kV and equipped
with a Nanosprint5 CMOS camera (AMT, Woburn, MA).
Western blotting: NDEVs protein lysates and reference samples were processed using the WES apparatus
and 25-sample cartridges containing loading buffer and secondary antibodies (ProteinSimple), according to
the manufacturer’s instructions (for specific antibodies, see Table 3).
Proteomic analysis: Isolated NDEVs samples were sent to Tymora Analytical LLC for proteomic analysis
using a proprietary procedure optimized for EV analysis.
Lipidomic analysis: Lipidomic profiling of NDEVs was performed by ultra performance liquid
chromatography-tandem mass spectrometry (UPLC-MSMS) at the Columbia University Lipidomic Facility,
[24]
as described previously .
Nanoparticle tracking analysis: NDEV preparations were diluted 10 times in pre-filtered PBS (20 mm
filters), and NTA analysis was performed using NanoSight 500 (Malvern Panalytical) as described