
Page 18 - Read Online
P. 18
Page 142 Eitan et al. Extracell Vesicles Circ Nucleic Acids 2023;4:133-150 https://dx.doi.org/10.20517/evcna.2023.13
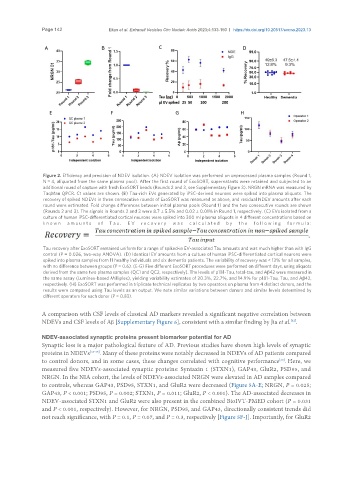
Figure 2. Efficiency and precision of NDEV isolation. (A) NDEV isolation was performed on unprocessed plasma samples (Round 1,
N = 4, aliquoted from the same plasma pool). After the first round of ExoSORT, supernatants were retained and subjected to an
additional round of capture with fresh ExoSORT beads (Rounds 2 and 3, see Supplementary Figure 3). NRGN mRNA was measured by
TaqMan QPCR. Ct values are shown. (B) Tau-rich EVs generated by iPSC-derived neurons were spiked into plasma aliquots. The
recovery of spiked NDEVs in three consecutive rounds of ExoSORT was measured as above, and residual NDEV amounts after each
round were estimated. Fold change differences between initial plasma pools (Round 1) and the two consecutive rounds are shown
(Rounds 2 and 3). The signals in Rounds 2 and 3 were 8.7 ± 5.5% and 0.02 ± 0.01% in Round 1, respectively. (C) EVs isolated from a
culture of human iPSC-differentiated cortical neurons were spiked into 300 ml plasma aliquots in 4 different concentrations based on
k n o w n a m o u n t s o f T a u . E V r e c o v e r y w a s c a l c u l a t e d b y t h e f o l l o w i n g f o r m u l a :
Tau recovery after ExoSORT remained uniform for a range of spiked-in EV-associated Tau amounts and was much higher than with IgG
control (P = 0.026, two-way ANOVA). (D) Identical EV amounts from a culture of human iPSC-differentiated cortical neurons were
spiked into plasma samples from 11 healthy individuals and six dementia patients. The variability of recovery was < 13% for all samples,
with no difference between groups (P = 0.6). (E-G) Five different ExoSORT procedures were performed on different days, using aliquots
derived from the same two plasma samples (QC1 and QC2, respectively). The levels of p181-Tau, total-tau, and Aβ42 were measured in
the same assay (Luminex-based Milliplex), yielding variability estimates of 20.3%, 22.7%, and 14.9% for p181-Tau, Tau, and Aβ42,
respectively. (H) ExoSORT was performed in triplicate technical replicates by two operators on plasma from 4 distinct donors, and the
results were compared using Tau levels as an output. We note similar variations between donors and similar levels determined by
different operators for each donor (P = 0.83).
A comparison with CSF levels of classical AD markers revealed a significant negative correlation between
NDEVs and CSF levels of Aβ [Supplementary Figure 6], consistent with a similar finding by Jia et al. .
[32]
NDEV-associated synaptic proteins present biomarker potential for AD
Synaptic loss is a major pathological feature of AD. Previous studies have shown high levels of synaptic
proteins in NDEVs [33-35] . Many of these proteins were notably decreased in NDEVs of AD patients compared
to control donors, and in some cases, these changes correlated with cognitive performance . Here, we
[33]
measured five NDEVs-associated synaptic proteins: Syntaxin 1 (STXN1), GAP43, GluR2, PSD95, and
NRGN. In the NIA cohort, the levels of NDEVs-associated NRGN were elevated in AD samples compared
to controls, whereas GAP43, PSD95, STXN1, and GluR2 were decreased (Figure 5A-E; NRGN, P = 0.025;
GAP43, P < 0.001; PSD95, P = 0.002; STXN1, P = 0.011; GluR2, P < 0.001). The AD-associated decreases in
NDEV-associated STXN1 and GluR2 were also present in the combined BioIVT-PMED cohort (P = 0.031
and P < 0.001, respectively). However, for NRGN, PSD95, and GAP43, directionally consistent trends did
not reach significance, with P = 0.1, P = 0.07, and P = 0.3, respectively [Figure 5F-J]. Importantly, for GluR2