
Page 16 - Read Online
P. 16
Page 140 Eitan et al. Extracell Vesicles Circ Nucleic Acids 2023;4:133-150 https://dx.doi.org/10.20517/evcna.2023.13
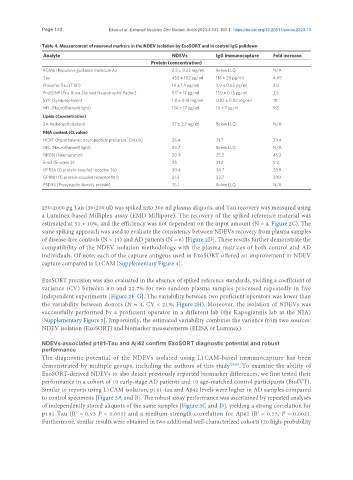
Table 4. Measurement of neuronal markers in the NDEV isolation by ExoSORT and in control IgG pulldown
Analyte NDEVs IgG immunocapture Fold increase
Protein (concentration)
RGMa (Repulsive guidance molecule A) 2.3 ± 0.22 mg/ml Below LLQ N/A
Tau 458 ± 102 pg/ml 118 ± 20 pg/ml 4.05
Phospho-Tau (T181) 10 ± 1.4 pg/ml 3.9 ± 0.62 pg/ml 3.0
ProBDNF (Pro-Brain-Derived Neurotrophic Factor) 517 ± 17 pg/ml 150 ± 0.13 pg/ml 3.6
SYP (Synaptophysin) 1.8 ± 0.18 mg/ml 0.22 ± 0.02 mg/ml 10
NFL (Neurofilament light) 134 ± 17 pg/ml 16 ± 7 pg.ml 9.3
Lipids (Concentration)
24-hydrohycholesterol 27 ± 2.7 ng/ml Below LLQ N/A
RNA content (Ct value)
HCRT (hypothalamic neuropeptide precursor, Orexin) 26.4 31.7 39.4
NFL (Neurofilament light) 29.7 Below LLQ N/A
NRGN (Neurogranin) 20.8 25.3 45.2
Eno2 (Enolase 2) 28 31.2 9.2
GPR26 (G protein-coupled receptor 26) 30.4 34.7 25.9
GPR101 (G protein-coupled receptor 101) 21.3 32.7 200
PSD95 (Presynaptic density protein) 35.1 Below LLQ N/A
250-2000 pg Tau (30-200 ul) was spiked into 300 ml plasma aliquots, and Tau recovery was measured using
a Luminex-based Milliplex assay (EMD Millipore). The recovery of the spiked reference material was
estimated at 51 ± 10%, and the efficiency was not dependent on the input amount (N = 4, Figure 2C). The
same spiking approach was used to evaluate the consistency between NDEVs recovery from plasma samples
of disease-free controls (N = 11) and AD patients (N = 6) [Figure 2D]. These results further demonstrate the
compatibility of the NDEV isolation methodology with the plasma matrices of both control and AD
individuals. Of note, each of the capture antigens used in ExoSORT offered an improvement in NDEV
capture compared to L1CAM [Supplementary Figure 4].
ExoSORT precision was also evaluated in the absence of spiked reference standards, yielding a coefficient of
variance (CV) between 8.0 and 22.7% for two random plasma samples processed repeatedly in five
independent experiments [Figure 2E-G]. The variability between two proficient operators was lower than
the variability between donors (N = 4, CV < 21%; Figure 2H). Moreover, the isolation of NDEVs was
successfully performed by a proficient operator in a different lab (the Kapogiannis lab at the NIA)
[Supplementary Figure 5]. Importantly, the estimated variability combines the variance from two sources:
NDEV isolation (ExoSORT) and biomarker measurements (ELISA or Luminex).
NDEVs-associated p181-Tau and Aβ42 confirm ExoSORT diagnostic potential and robust
performance
The diagnostic potential of the NDEVs isolated using L1CAM-based immunocapture has been
demonstrated by multiple groups, including the authors of this study [29,30] . To examine the ability of
ExoSORT-derived NDEVs to also detect previously reported biomarker differences, we first tested their
performance in a cohort of 10 early-stage AD patients and 10 age-matched control participants (BioIVT).
Similar to reports using L1CAM isolation, p181-tau and Aβ42 levels were higher in AD samples compared
to control specimens [Figure 3A and B]. The robust assay performance was ascertained by repeated analyses
of independently stored aliquots of the same samples [Figure 3C and D], yielding a strong correlation for
2
2
p181-Tau (R = 0.93 P < 0.001) and a medium-strength correlation for Aβ42 (R = 0.55, P = 0.002).
Furthermore, similar results were obtained in two additional well-characterized cohorts (20 high-probability