
Page 20 - Read Online
P. 20
Page 144 Eitan et al. Extracell Vesicles Circ Nucleic Acids 2023;4:133-150 https://dx.doi.org/10.20517/evcna.2023.13
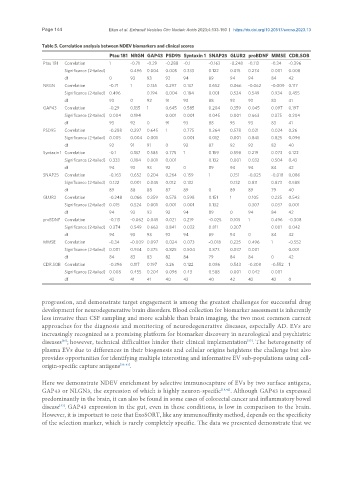
Table 5. Correlation analysis between NDEV biomarkers and clinical scores
Ptau 181 NRGN GAP43 PSD95 Syntaxin 1 SNAP25 GLUR2 proBDNF MMSE CDR.SOB
Ptau 181 Correlation 1 -0.71 -0.29 -0.288 -0.1 -0.163 -0.248 -0.113 -0.34 -0.396
Significance (2-tailed) 0.496 0.004 0.005 0.333 0.122 0.015 0.274 0.001 0.008
df 0 93 93 92 94 89 94 94 84 42
NRGN Correlation -0.71 1 0.135 0.297 0.137 0.652 0.066 -0.062 -0.009 0.117
Significance (2-tailed) 0.496 0.194 0.004 0.184 0.001 0.524 0.549 0.934 0.455
df 93 0 92 91 93 88 93 93 83 41
GAP43 Correlation -0.29 0.135 1 0.645 0.585 0.204 0.359 0.045 0.097 0.197
Significance (2-tailed) 0.004 0.194 0.001 0.001 0.045 0.001 0.663 0.375 0.204
df 93 92 0 91 93 88 93 93 83 41
PSD95 Correlation -0.288 0.297 0.645 1 0.775 0.264 0.578 0.021 0.024 0.26
Significance (2-tailed) 0.005 0.004 0.001 0.001 0.012 0.001 0.841 0.825 0.096
df 92 91 91 0 92 87 92 92 82 40
Syntaxin 1 Correlation -0.1 0.137 0.585 0.775 1 0.159 0.598 0.219 0.073 0.122
Significance (2-tailed) 0.333 0.184 0.001 0.001 0.132 0.001 0.032 0.504 0.43
df 94 93 93 92 0 89 94 94 84 42
SNAP25 Correlation -0.163 0.652 0.204 0.264 0.159 1 0.151 -0.025 -0.018 0.086
Significance (2-tailed) 0.122 0.001 0.045 0.012 0.132 0.132 0.811 0.873 0.588
df 89 88 88 87 89 0 89 89 79 40
GLUR2 Correlation -0.248 0.066 0.359 0.578 0.598 0.151 1 0.105 0.225 0.543
Significance (2-tailed) 0.015 0.524 0.001 0.001 0.001 0.132 0.307 0.037 0.001
df 94 93 93 92 94 89 0 94 84 42
proBDNF Correlation -0.113 -0.062 0.045 0.021 0.219 -0.025 0.105 1 0.496 -0.308
Significance (2-tailed) 0.274 0.549 0.663 0.841 0.032 0.811 0.307 0.001 0.042
df 94 93 93 92 94 89 94 0 84 42
MMSE Correlation -0.34 -0.009 0.097 0.024 0.073 -0.018 0.225 0.496 1 -0.552
Significance (2-tailed) 0.001 0.934 0.375 0.825 0.504 0.873 0.037 0.001 0.001
df 84 83 83 82 84 79 84 84 0 42
CDR.SOB Correlation -0.396 0.117 0.197 0.26 0.122 0.086 0.543 -0.308 -0.552 1
Significance (2-tailed) 0.008 0.455 0.204 0.096 0.43 0.588 0.001 0.042 0.001
df 42 41 41 40 42 40 42 42 42 0
progression, and demonstrate target engagement is among the greatest challenges for successful drug
development for neurodegenerative brain disorders. Blood collection for biomarker assessment is inherently
less invasive than CSF sampling and more scalable than brain imaging, the two most common current
approaches for the diagnosis and monitoring of neurodegenerative diseases, especially AD. EVs are
increasingly recognized as a promising platform for biomarker discovery in neurological and psychiatric
diseases ; however, technical difficulties hinder their clinical implementation . The heterogeneity of
[36]
[37]
plasma EVs due to differences in their biogenesis and cellular origins heightens the challenge but also
provides opportunities for identifying multiple interesting and informative EV sub-populations using cell-
origin-specific capture antigens [38-41] .
Here we demonstrate NDEV enrichment by selective immunocapture of EVs by two surface antigens,
GAP43 or NLGN3, the expression of which is highly neuron-specific [18,42] . Although GAP43 is expressed
predominantly in the brain, it can also be found in some cases of colorectal cancer and inflammatory bowel
disease . GAP43 expression in the gut, even in these conditions, is low in comparison to the brain.
[43]
However, it is important to note that ExoSORT, like any immunoaffinity method, depends on the specificity
of the selection marker, which is rarely completely specific. The data we presented demonstrate that we