
Page 22 - Read Online
P. 22
Page 146 Eitan et al. Extracell Vesicles Circ Nucleic Acids 2023;4:133-150 https://dx.doi.org/10.20517/evcna.2023.13
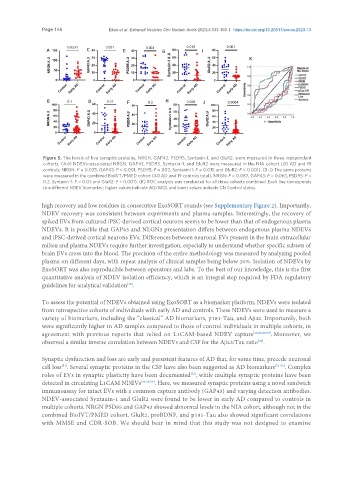
Figure 5. The levels of five synaptic proteins, NRGN, GAP43, PSD95, Syntaxin-1, and GluR2, were measured in three independent
cohorts. (A-I) NDEVs-associated NRGN, GAP43, PSD95, Syntaxin-1, and GluR2 were measured in the NIA cohort (20 AD and 19
controls; NRGN: P = 0.025, GAP43: P < 0.001, PSD95: P = 002, Syntaxin-1: P = 0.011, and GluR2: P < 0.001). (B-J) The same proteins
were measured in the combined BioIVT/PMED cohort (40 AD and 19 controls total), NRGN: P = 0.087, GAP43: P = 0.063, PSD95: P =
0.2, Syntaxin-1: P = 0.03 and GluR2: P < 0.001). (K) ROC analysis was conducted for all three cohorts combined. Each line corresponds
to a different NDEV biomarker; higher values indicate AD/MCI, and lower values indicate CN Control status.
high recovery and low residues in consecutive ExoSORT rounds (see Supplementary Figure 2). Importantly,
NDEV recovery was consistent between experiments and plasma samples. Interestingly, the recovery of
spiked EVs from cultured iPSC-derived cortical neurons seems to be lower than that of endogenous plasma
NDEVs. It is possible that GAP43 and NLGN3 presentation differs between endogenous plasma NDEVs
and iPSC-derived cortical neurons EVs. Differences between neuronal EVs present in the brain extracellular
milieu and plasma NDEVs require further investigation, especially to understand whether specific subsets of
brain EVs cross into the blood. The precision of the entire methodology was measured by analyzing pooled
plasma on different days, with repeat analysis of clinical samples being below 20%. Isolation of NDEVs by
ExoSORT was also reproducible between operators and labs. To the best of our knowledge, this is the first
quantitative analysis of NDEV isolation efficiency, which is an integral step required by FDA regulatory
[48]
guidelines for analytical validation .
To assess the potential of NDEVs obtained using ExoSORT as a biomarker platform, NDEVs were isolated
from retrospective cohorts of individuals with early AD and controls. These NDEVs were used to measure a
variety of biomarkers, including the “classical” AD biomarkers, p181-Tau, and Aβ42. Importantly, both
were significantly higher in AD samples compared to those of control individuals in multiple cohorts, in
agreement with previous reports that relied on L1CAM-based NDEV capture [10,29,49,50] . Moreover, we
observed a similar inverse correlation between NDEVs and CSF for the Aβ42/Tau ratio .
[32]
Synaptic dysfunction and loss are early and persistent features of AD that, for some time, precede neuronal
cell loss . Several synaptic proteins in the CSF have also been suggested as AD biomarkers [51-53] . Complex
[51]
roles of EVs in synaptic plasticity have been documented , while multiple synaptic proteins have been
[52]
detected in circulating L1CAM NDEVs [34,35,54] . Here, we measured synaptic proteins using a novel sandwich
immunoassay for intact EVs with a common capture antibody (GAP43) and varying detection antibodies.
NDEV-associated Syntaxin-1 and GluR2 were found to be lower in early AD compared to controls in
multiple cohorts. NRGN PSD95 and GAP43 showed abnormal levels in the NIA cohort, although not in the
combined BioIVT/PMED cohort. GluR2, proBDNF, and p181-Tau also showed significant correlations
with MMSE and CDR-SOB. We should bear in mind that this study was not designed to examine