
Page 19 - Read Online
P. 19
Eitan et al. Extracell Vesicles Circ Nucleic Acids 2023;4:133-150 https://dx.doi.org/10.20517/evcna.2023.13 Page 143
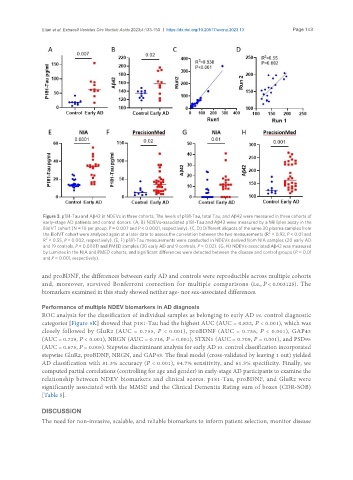
Figure 3. p181-Tau and Aβ42 in NDEVs in three cohorts. The levels of p181-Tau, total Tau, and Aβ42 were measured in three cohorts of
early-stage AD patients and control donors. (A, B) NDEVs-associated p181-Tau and Aβ42 were measured by a Milliplex assay in the
BioIVT cohort (N = 10 per group, P = 0.007 and P < 0.0001, respectively). (C, D) Different aliquots of the same 20 plasma samples from
2
the BioIVT cohort were analyzed again at a later date to assess the correlation between the two measurements (R = 0.93, P < 0.01 and
2
R = 0.55, P < 0.002, respectively). (E, F) p181-Tau measurements were conducted in NDEVs derived from NIA samples (20 early AD
and 19 controls, P < 0.0001) and PMED samples (30 early AD and 9 controls, P = 0.02). (G, H) NDEVs-associated Aβ42 was measured
by Luminex in the NIA and PMED cohorts, and significant differences were detected between the disease and control groups (P = 0.01
and P = 0.001, respectively).
and proBDNF, the differences between early AD and controls were reproducible across multiple cohorts
and, moreover, survived Bonferroni correction for multiple comparisons (i.e., P < 0.003125). The
biomarkers examined in this study showed neither age- nor sex-associated differences.
Performance of multiple NDEV biomarkers in AD diagnosis
ROC analysis for the classification of individual samples as belonging to early AD vs. control diagnostic
categories [Figure 5K] showed that p181-Tau had the highest AUC (AUC = 0.832, P < 0.001), which was
closely followed by GluR2 (AUC = 0.755, P < 0.001), proBDNF (AUC = 0.736, P < 0.001), GAP43
(AUC = 0.729, P < 0.001), NRGN (AUC = 0.716, P = 0.001), STXN1 (AUC = 0.709, P = 0.001), and PSD95
(AUC = 0.675, P = 0.005). Stepwise discriminant analysis for early AD vs. control classification incorporated
stepwise GluR2, proBDNF, NRGN, and GAP43. The final model (cross-validated by leaving 1 out) yielded
AD classification with 81.3% accuracy (P < 0.001), 94.7% sensitivity, and 61.5% specificity. Finally, we
computed partial correlations (controlling for age and gender) in early-stage AD participants to examine the
relationship between NDEV biomarkers and clinical scores. p181-Tau, proBDNF, and GluR2 were
significantly associated with the MMSE and the Clinical Dementia Rating sum of boxes (CDR-SOB)
[Table 5].
DISCUSSION
The need for non-invasive, scalable, and reliable biomarkers to inform patient selection, monitor disease