
Page 14 - Read Online
P. 14
Page 138 Eitan et al. Extracell Vesicles Circ Nucleic Acids 2023;4:133-150 https://dx.doi.org/10.20517/evcna.2023.13
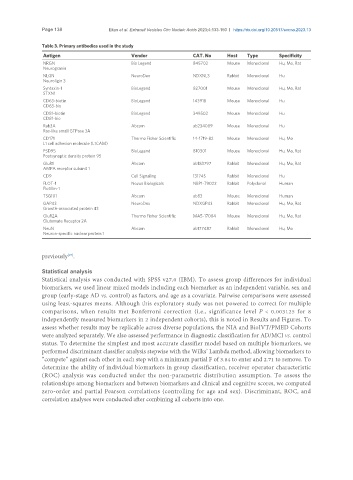
Table 3. Primary antibodies used in the study
Antigen Vendor CAT. No Host Type Specificity
NRGN Bio Legend 845702 Mouse Monoclonal Hu, Mo, Rat
Neurogranin
NLGN NeuroDex NDXNL3 Rabbit Monoclonal Hu
Neuroligin 3
Syntaxin-1 BioLegend 827001 Mouse Monoclonal Hu, Mo, Rat
STXN1
CD63-biotin BioLegend 143918 Mouse Monoclonal Hu
CD63-bio
CD81-biotin BioLegend 349502 Mouse Monoclonal Hu
CD81-bio
Rab3A Abcam ab234089 Mouse Monoclonal Hu
Ras-like small GTPase 3A
CD171 Thermo Fisher Scientific 14-1719-82 Mouse Monoclonal Hu, Mo
L1 cell adhesion molecule (L1CAM)
PSD95 BioLegend 810301 Mouse Monoclonal Hu, Mo, Rat
Postsynaptic density protein 95
GluR1 Abcam ab183797 Rabbit Monoclonal Hu, Mo, Rat
AMPA receptor subunit 1
CD9 Cell Signaling 13174S Rabbit Monoclonal Hu
FLOT-1 Novus Biologicals NBP1-79022 Rabbit Polyclonal Human
Flotillin-1
TSG101 Abcam ab83 Mouse Monoclonal Human
GAP43 NeuroDex NDXGP43 Rabbit Monoclonal Hu, Mo, Rat
Growth-associated protein 43
GluR2A Thermo Fisher Scientific MA5-17084 Mouse Monoclonal Hu, Mo, Rat
Glutamate Receptor 2A
NeuN Abcam ab177487 Rabbit Monoclonal Hu, Mo
Neuron-specific nuclear protein 1
[25]
previously .
Statistical analysis
Statistical analysis was conducted with SPSS v27.0 (IBM). To assess group differences for individual
biomarkers, we used linear mixed models including each biomarker as an independent variable, sex and
group (early-stage AD vs. control) as factors, and age as a covariate. Pairwise comparisons were assessed
using least-squares means. Although this exploratory study was not powered to correct for multiple
comparisons, when results met Bonferroni correction (i.e., significance level P < 0.003125 for 8
independently measured biomarkers in 2 independent cohorts), this is noted in Results and Figures. To
assess whether results may be replicable across diverse populations, the NIA and BioIVT/PMED Cohorts
were analyzed separately. We also assessed performance in diagnostic classification for AD/MCI vs. control
status. To determine the simplest and most accurate classifier model based on multiple biomarkers, we
performed discriminant classifier analysis stepwise with the Wilks’ Lambda method, allowing biomarkers to
“compete” against each other in each step with a minimum partial F of 3.84 to enter and 2.71 to remove. To
determine the ability of individual biomarkers in group classification, receiver operator characteristic
(ROC) analysis was conducted under the non-parametric distribution assumption. To assess the
relationships among biomarkers and between biomarkers and clinical and cognitive scores, we computed
zero-order and partial Pearson correlations (controlling for age and sex). Discriminant, ROC, and
correlation analyses were conducted after combining all cohorts into one.