
Page 12 - Read Online
P. 12
Page 136 Eitan et al. Extracell Vesicles Circ Nucleic Acids 2023;4:133-150 https://dx.doi.org/10.20517/evcna.2023.13
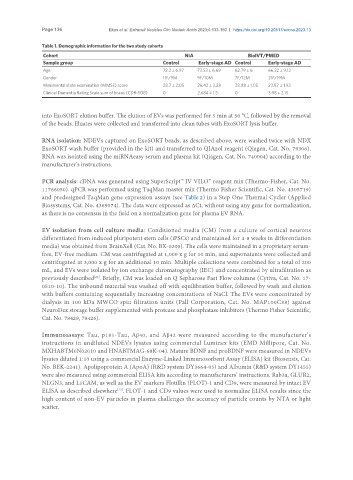
Table 1. Demographic information for the two study cohorts
Cohort NIA BioIVT/PMED
Sample group Control Early-stage AD Control Early-stage AD
Age 72.3 ± 6.97 73.53 ± 6.69 62.79 ± 6 66.22 ± 9.12
Gender 11F/9M 9F/10M 7F/12M 21F/19M
Mini mental state examination (MMSE) score 28.7 ± 2.05 26.42 ± 3.28 28.88 ± 1.05 23.87 ± 1.93
Clinical Dementia Rating Scale sum of boxes (CDR-SOB) 0 2.684 ± 1.5 0 3.98 ± 2.15
into ExoSORT elution buffer. The elution of EVs was performed for 5 min at 50 °C, followed by the removal
of the beads. Eluates were collected and transferred into clean tubes with ExoSORT lysis buffer.
RNA isolation: NDEVs captured on ExoSORT beads, as described above, were washed twice with NDX
ExoSORT wash buffer (provided in the kit) and transferred to QIAzol reagent (Qiagen, Cat. No. 79306).
RNA was isolated using the miRNAeasy serum and plasma kit (Qiagen, Cat. No. 740004) according to the
manufacturer’s instructions.
PCR analysis: cDNA was generated using SuperScript™ IV VILO™ reagent mix (Thermo-Fisher, Cat. No.
11766050). qPCR was performed using TaqMan master mix (Thermo Fisher Scientific, Cat. No. 4305719)
and predesigned TaqMan gene expression assays (see Table 2) in a Step One Thermal Cycler (Applied
Biosystems, Cat. No. 4369074). The data were expressed as ΔCt, without using any gene for normalization,
as there is no consensus in the field on a normalization gene for plasma EV RNA.
EV isolation from cell culture media: Conditioned media (CM) from a culture of cortical neurons
differentiated from induced pluripotent stem cells (iPSCs) and maintained for 4-8 weeks in differentiation
media) was obtained from BrainXell (Cat. No. BX-0200). The cells were maintained in a proprietary serum-
free, EV-free medium. CM was centrifugated at 1,000 x g for 10 min, and supernatants were collected and
centrifugated at 3,000 x g for an additional 10 min. Multiple collections were combined for a total of 200
mL, and EVs were isolated by ion exchange chromatography (IEC) and concentrated by ultrafiltration as
previously described . Briefly, CM was loaded on Q Sepharose Fast Flow columns (Cytiva, Cat. No. 17-
[22]
0510-10). The unbound material was washed off with equilibration buffer, followed by wash and elution
with buffers containing sequentially increasing concentrations of NaCl. The EVs were concentrated by
dialysis in 100 kDa MWCO spin filtration units (Pall Corporation, Cat. No. MAP100C38) against
NeuroDex storage buffer supplemented with protease and phosphatase inhibitors (Thermo Fisher Scientific,
Cat. No. 78429, 78426).
Immunoassays: Tau, p181-Tau, Aβ40, and Aβ42 were measured according to the manufacturer’s
instructions in undiluted NDEVs lysates using commercial Luminex kits (EMD Millipore, Cat. No.
MXHABTM0N02010 and HNABTMAG-68K-04). Mature BDNF and proBDNF were measured in NDEVs
lysates diluted 1:10 using a commercial Enzyme-Linked Immunosorbent Assay (ELISA) kit (Biosensis, Cat.
No. BEK-2241). Apolipoprotein A (ApoA) (R&D system DY3664-05) and Albumin (R&D system DY1455)
were also measured using commercial ELISA kits according to manufacturers’ instructions. Rab3a, GLUR2,
NLGN3, and L1CAM, as well as the EV markers Flotillin (FLOT)-1 and CD9, were measured by intact EV
ELISA as described elsewhere . FLOT-1 and CD9 values were used to normalize ELISA results since the
[23]
high content of non-EV particles in plasma challenges the accuracy of particle counts by NTA or light
scatter.